In the previous article in this series, I talked about the fallacy of ‘average’ performance. Now that this has been dismissed, what do I propose to replace it with. There are three aggregated values that can be used to better represent Web performance data:
- Median
- Geometric Mean
- 85th (or higher) Percentile
The links take you to articles that better explain the math behind each of these statistics. The focus here is why you would choose to use them rather than Arithmetic Mean.
The Median is the central point in any population of data. It is equal to the calculated value of the 50th Percentile, and is the point where half of the population lies above and below. So, in a large population of data, it can provide a good estimation of where center or average performance value is, regardless of the outliers at either end of the scale.
Geometric Mean is, well, a nasty calculation that I prefer to allow programmatic functions to handle for me. The advantage that it has over the Arithmetic Mean is that is influenced less by the outliers, producing a value that is always lower than or equal to the Arithmetic Mean. In the case of Web performance data, with populations of any size, the Geometric Mean is always lower than the Arithmetic Mean.
The 85th Percentile is the level below which 85% of the population of data lies. Now, some people use the 90th or the 95th, but I tend to cut Web sites more slack by granting them a pass on 15% of the measurement population.
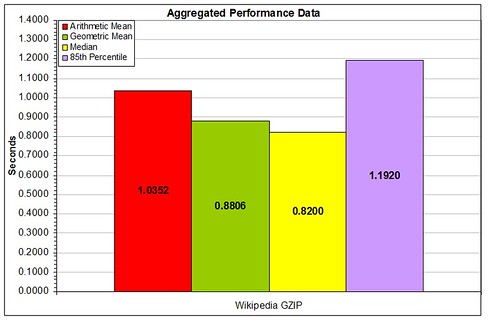
So, what do these values look like?

These aggregated performance values are extracted from the same data population. Immediately, some things become clear. The Arithmetic Mean is higher than the Median and the Geometric Mean, by more than 0.1 seconds. The 85th Percentile is 1.19 seconds and indicates that 85% of all measurements in this data set are below this value.
Things that are bad to see:
- An Arithmetic Mean that is substantially higher than the Geometric Mean and the Median
- An 85th Percentile that is more than double the Geometric Mean
In these two cases, it indicates that there is a high number of large values in the measurement population, and that the site is exhibiting consistency issues, a topic for a later article in this series.
In all, these three metric provide a good quick hit, a representative single number that you can present in a meeting to say how the site is performing. But they all suffer from the same flaw — you cannot represent the entire population with an entire number.
The next article will discuss Frequency Distributions, and their value in the Web performance analysis field.
Leave a Reply