Month: October 2006

Port80 Software: IIS 6.0 Market Share Increases in Fortune 1000

Port80 Software is reporting that in their survey of Fortune 1000 Web sites, IIS 6.0 has overtaken Apache as the Web server platform of choice. [here]

My two-cents: I respect the Port80 Software team greatly and love their maniacal devotion to ensuring that IIS users actually make use of the HTTP compression and caching that can so greatly improve Web performance.

That said, they are tied to Microsoft and the IIS platform. I would be curious to see if, scratching below the surface, they were able to determine what the application platform these companies built their mission critical Web applications on. I am open-minded and willing to hear that IIS is winning in that area as well. In my mind, it’s about Web performance tuning, not what you use to get that performance.

That said, I think a critical Web application survey of these same firms would find that many of these companies rely on JSP servers to run their core business processes.

As well, it would be interesting to se, by Fortune 1000 ranking, what the companies are using what server platform.

And…people still use Netscape Enterprise, SunOne, and Domino as production Web servers? YIKES!

Guilty Pleasures: Go Insane

As a teenager growing up in a very small logging town in the BC interior, I had what could be politely termed unusual musical tastes, especially for the mainstream, heavy-metal, hair-banging kids I hung around with.

But when I was alone with my walkman, I listened to the real geniuses of 80s rock: REM, Kate Bush, Talking Heads, and…Lindsey Buckingham.

Lindsey Buckingham?? That guy from Fleetwood Mac?

Want a little aural treat? Listen to Go Insane. I literally wore the oxide off my version of the cassette. Crosses so many different boundaries…and realize that you are pretty much hearing Lindsey Buckingham only. Mick Fleetwood makes a couple appearances, but other than that, it is a one-man show.

Do it. I dare you.

USS George H.W. Bush

Today, they christened the Nimitz-class carrier, George H.W. Bush.
Still a few bugs to work out. Seems the navigation system breaks down after it has seen battle, causing it to wander aimlessly, and eventually become lost. It is especially vulnerable to attack by more than one enemy simultaneously, which in some simulations has forced the commander to surrender the vessel.
I also hear that they have started CAD drawings for the Seawolf-class nuclear submarine SSN George W Bush. Not only is it designed to be isolated from and out of contact with the rest of the world for long periods of time, I hear that it will have a new command feature: all fleet orders, battle information, or damage reports are first filtered through the boat’s Media Relations Officer before being passed to the commander.
File Under: Humor.

Aren't tracer rounds illegal?

So, after 6 years of controlling and managing my own Web server, I have handed responsibility over to 1 & 1. I wish I could say that there was a really good reason why I’ve done this, but frankly, it’s because I don’t need a lot of oooommmmph for my personal domains (they run happily on a low-end Pentium II Celeron), and the price was right.
GrabPERF is still happily hosted by the folks at Technorati, while WordPress.com controls my blog.
In some ways, I am glad that someone else has these headaches now.

Performance Improvement From Caching and Compression

This paper is an extension of the work done for another article that highlighted the performance benefits of retrieving uncompressed and compressed objects directly from the origin server. I wanted to add a proxy server into the stream and determine if proxy servers helped improve the performance of object downloads, and by how much.
Using the same series of objects in the original compression article[1], the CURL tests were re-run 3 times:

  1. Directly from the origin server
  2. Through the proxy server, to load the files into cache
  3. Through the proxy server, to avoid retrieving files from the origin.[2]

This series of three tests was repeated twice: once for the uncompressed files, and then for the compressed objects.[3]
As can be seen clearly in the plots below, compression caused web page download times to improve greatly, when the objects were retrieved from the source. However, the performance difference between compressed and uncompressed data all but disappears when retrieving objects from a proxy server on a corporate LAN.

uncompressed_pages
compressed_pages

Instead of the linear growth between object size and download time seen in both of the retrieval tests that used the origin server (Source and Proxy Load data), the Proxy Draw data clearly shows the benefits that accrue when a proxy server is added to a network to assist with serving HTTP traffic.

 MEAN DOWNLOAD TIME
Uncompressed Pages
Total Time Uncompressed — No Proxy0.256
Total Time Uncompressed — Proxy Load0.254
Total Time Uncompressed — Proxy Draw0.110
Compressed Pages
Total Time Compressed — No Proxy0.181
Total Time Compressed — Proxy Load0.140
Total Time Compressed — Proxy Draw0.104

The data above shows just how much of an improvement is gained by adding a local proxy server, explicit caching descriptions and compression can add to a Web site. For sites that do force a great of requests to be returned directly to the origin server, compression will be of great help in reducing bandwidth costs and improving performance. However, by allowing pages to be cached in local proxy servers, the difference between compressed and uncompressed pages vanishes.

Conclusion

Compression is a very good start when attempting to optimize performance. The addition of explicit caching messages in server responses which allow proxy servers to serve cached data to clients on remote local LANs can improve performance to even a greater extent than compression can. These two should be used together to improve the overall performance of Web sites.


[1]The test set was made up of the 1952 HTML files located in the top directory of the Linux Documentation Project HTML archive.

[2]All of the pages in these tests announced the following server response header indicating its cacheability:

Cache-Control: max-age=3600

[3]A note on the compressed files: all compression was performed dynamically by mod_gzip for Apache/1.3.27.

Performance Improvement From Compression

How much improvement can you see with compression? The difference in measured download times on a very lightly loaded server indicates that the time to download the Base Page (the initial HTML file) improved by between 1.3 and 1.6 seconds across a very slow connection when compression was used.

Base Page Performance

There is a slightly slower time for the server to respond to a client requesting a compressed page. Measurements show that the median response time for the server averaged 0.23 seconds for the uncompressed page and 0.27 seconds for the compressed page. However, most Web server administrators should be willing to accept a 0.04 increase in response time to achieve a 1.5 second improvement in file transfer time.

First Byte Performance

Web pages are not completely HTML. How do improved HTML (and CSS) download times affect overall performance? The graph below shows that overall download times for the test page were 1 to 1.5 seconds better when the HTML files were compressed.

Total Page Performance

To further emphasize the value of compression, I ran a test on a Web server to see what the average compression ratio would be when requesting a very large number of files. As well, I wanted to determine what the affect on server response time would be when requesting large numbers of compressed files simultaneously.

There were 1952 HTML files in the test directory and I checked the results using CURL across my local LAN.[1]


Large sample of File Requests (1952 HTML Files)

mod_gzip

  UncompressedCompressed
First Byte   
 Mean0.0910.084
 Median0.0300.036
Total Time   
 Mean0.2800.128
 Median0.1730.079
Bytes per Page   
 Mean63492416
 Median37501543
Total Bytes 123923184716160

mod_deflate[2]

  UncompressedCompressed
First Byte   
 Mean0.0440.046
 Median0.0280.031
Total Time   
 Mean0.2410.107
 Median0.1690.050
Bytes per Page   
 Mean63492418
 Median37501544
Total Bytes 123923184720735
 mod_gzipmod_deflate
Average Compression0.4330.438
Median Compression0.4270.427

As expected, the First Byte download time was slightly higher with the compressed files than it was with the uncompressed files. But this difference was in milliseconds, and is hardly worth mentioning in terms of on-the-fly compression. It is unlikely that any user, especially dial-up users, would notice this difference in performance.

That the delivered data was transformed to 43% of the original file size should make any Web administrator sit up and notice. The compression ratio for the test files ranged from no compression for files that were less than 300 bytes, to 15% of original file size for two of the Linux SCSI Programming HOWTOs.

Compression ratios do not increase in a linear fashion when compared to file size; rather, compression depends heavily on the repetition of content within a file to gain its greatest successes. The SCSI Programming HOWTOs have a great deal of repeated characters, making them ideal candidates for extreme compression.

Smaller files also did not compress as well as larger files, exactly for this reason. Fewer bytes means a lower probability of repeated bytes, resulting in a lower compression ratio.


Average Compression by File Size

  mod_gzip mod_deflate
0-999 0.713 0.777[3]
1000-4999 0.440 0.440
5000-9999 0.389 0.389
10000-19999 0.369 0.369
20000-49999 0.350 0.350
50000 and up 0.329 0.331
 mod_gzipmod_deflate0-9990.7130.777[3]1000-49990.4400.4405000-99990.3890.38910000-199990.3690.36920000-499990.3500.35050000 and up0.3290.331
 mod_gzipmod_deflate
0-9990.7130.777[3]
1000-49990.4400.440
5000-99990.3890.389
10000-199990.3690.369
20000-499990.3500.350
50000 and up0.3290.331

The data shows that compression works best on files larger than 5000 bytes; after that size, average compression gains are smaller, unless a file has a large number of repeated characters. Some people argue that compressing files below a certain size is a wasteful use of CPU cycles. If you agree with these folks, using the 5000 byte value as floor value for compressing files should be a good starting point. I am of the opposite mindset: I compress everything that comes off my servers because I consider myself an HTTP overclocker, trying to squeeze every last bit of download performance out of the network.

Conclusion

With a few simple commands, and a little bit of configuration, an Apache Web server can be configured to deliver a large amount of content in a compressed format. These benefits are not simply limited to static pages; dynamic pages generated by PHP and other dynamic content generators can be compressed by using the Apache compression modules. When added other performance tuning mechanisms and appropriate server-side caching rules, these modules can substantially reduce the bandwidth for a very low cost.


[1] The files were the top level HTML files from the Linux Documentation Project. They were installed on an Apache 1.3.27 server running mod_gzip and an Apache 2.0.44 server using mod_deflate. Minimum file size was 80 bytes and maximum file size was 99419 bytes.

[2] mod_deflate for Apache/2.0.44 and earlier comes with the compression ratio set for Best Speed, not Best Compression. This configuration can be modified using the tips found here; and starting with Apache/2.0.45, there will be a configuration directive that will allow admins to configure the compression ratio that they want.

In this example, the compression ratio was set to Level 6.

[3] mod_deflate does not have a lower bound for file size, so it attempts to compress files that are too small to benefit from compression. This results in files smaller than approximately 120 bytes becoming larger when processed by mod_deflate.

Baseline Testing With cURL

cURL is an application that can be used to retrieve any Internet file that uses the standard URL format — http://, ftp://, gopher://, etc. Its power and flexibility can be added to applications by using the libcurl library, whose API can be accessed easily using most of the commonly used scripting and programming languages.

So, how does cURL differ from some of the other command-line URL retrieval tools such as WGET? Both do very similar things, and can be coaxed to retrieve large lists of files or even mirror entire Web sites. In fact, for the automated retrieval of single files for the Internet for storage on local filesystems — such as downloading source files onto servers for building applications — WGET’s syntax is the simplest to use.

However, for simple baseline testing, WGET lacks cURL’s ability to produce timing results that can be written to an output file in a user-configurable format. cURL gathers a large amount of data about a transfer that can then be used for analysis or logging purposes. This makes it a step ahead of WGET for baseline testing.

cURL Installation

For the purposes of our testing, we have used cURL 7.10.5-pre2 as it adds support for downloading and interpreting GZIP-encoded content from Web servers. Because it is a pre-release version, it is currently only available as source for compiling. The compilation was smooth, and straight-forward.

$ ./configure --with-ssl --with-zlib
$ make
$ make test
[...runs about 120 checks to ensure the application and library will work as expected..]
# make install

The application installed in /usr/local/bin on my RedHat 9.0 laptop.
Testing cURL is straight-forward as well.

$ curl http://slashdot.org/
[...many lines of streaming HTML omitted...]

Variations on this standard theme include:

  • Send output to a file instead of STDOUT
	$ curl -o ~/slashdot.txt http://slashdot.org/
  • Request compressed content if the Web server supports it
	$ curl --compressed http://slashdot.org/
  • Provide total byte count for downloaded HTML
	$ curl -w %{size_download} http://slashdot.org/

Baseline Testing with cURL

With the application installed, you can now begin to design a baseline test. This methodology is NOT a replacement for true load testing, but rather a method for giving small and medium-sized businesses a sense of how well their server will perform before it is deployed into production, as well as providing a baseline for future tests. This baseline can then be used as a basis for comparing performance after configuration changes in the server environment, such as caching rule changes or adding solutions that are designed to accelerate Web performance.

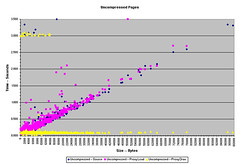
To begin, a list of URLs needs to be drawn up and agreed to as a baseline for the testing. For my purposes, I use the files from the Linux Documentation project, intermingled with a number of images. This provides the test with a variety of file sizes and file types. You could construct your own file-set out of any combination of documents/files/images you wish. However, the file-set should be large — mine runs to 2134 files.

Once the file-set has been determined, it should be archived so that this same group can be used for future performance tests; burning it to a CD is always a safe bet.

Next, extract the filenames to a text file so that the configuration file for the tests can be constructed. I have done this for my tests, and have it set up in a generic format so that when I construct the configuration for the next test, I simply have to change/update the URL to reflect the new target.

The configuration of the rest of the parameters should be added to the configuration file at this point. These are all the same as the command line versions, except for the URL listing format.

  • Listing of test_config.txt
-A "Mozilla/4.0 (compatible; cURL 7.10.5-pre2; Linux 2.4.20)"
-L
-w @logformat.txt
-D headers.txt
-H "Pragma: no-cache"
-H "Cache-control: no-cache"
-H "Connection: close"
url="http://www.foobar.com/1.html"
url="http://www.foobar.com/2.png"
[...file listing...]

In the above example, I have set cURL to:

  • Use a custom User-Agent string
  • Follow any re-direction responses that contain a “Location:” response header
  • Dump the server response headers to headers.txt
  • Circumvent cached responses by sending the two main “no-cache” request headers
  • Close the TCP connection after each object is downloaded, overriding cURL’s default use of persistent connections
  • Format the timing and log output using the format that is described in logformat.txt

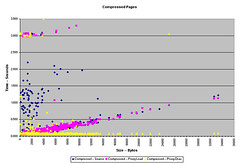
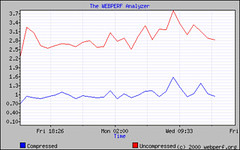
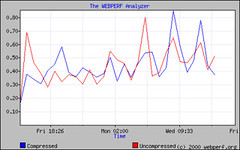
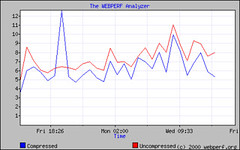
Another command-line option that I use a lot is –compressed, which, as of cURL 7.10.5, handles both the deflate and gzip encoding of Web content, including decompression on the fly. This is great for comparing the performance improvements and bandwidth savings from compression solutions against a baseline test without compression. Network administrators may also be interested in testing the improvement that they get using proxy servers and client-side caches by inserting –proxy <proxy[:port]> into the configuration, removing the “no-cache” headers, and testing a list of popular URLs through their proxy servers.

The logformat.txt file describes the variables that I find of interest and that I want to use for my analysis.

  • Listing of logformat.txt
\n
%{url_effective}\t%{http_code}\t%{content_type}\t%{time_total}\t%{time_lookup}\t /
	%{time_connect}\t%{time_starttransfer}\t{size_download}\n
\n

These variables are defined as:

  • url_effective: URL used to make the final request, especially when following re-directions
  • http_code: HTTP code returned by the server when delivering the final HTML page requested
  • content_type: MIME type returned in the final HTML request
  • time_total: Total time for the transfer to complete
  • time_lookup: Time from start of transfer until DNS Lookup complete
  • time_connect: Time from start of transfer until TCP connection complete
  • time_starttransfer: Time from start of transfer until data begins to be returned from the server
  • size_download: Total number of bytes transferred, excluding headers

As time_connect and time_starttransfer are cumulative from the beginning of the transfer, you have to do some math to come up with the actual values.

TCP Connection Time = time_connecttime_lookup
Time First Byte = time_starttransfertime_connect
Redirection Time = time_totaltime_starttransfer

If you are familiar with cURL, you may wonder why I have chosen not to write the output to a file using the -o <file> option. It appears that this option only records the output for the first file requested, even in a large list of files. I prefer to use the following command to start the test and then post-process the results using grep.

$ curl -K test_config.txt >> output_raw_1.txt
[...lines and lines of output...]
$ grep -i -r "^http://www.foobar.com/.*$" output_raw_1.txt >> output_processed_1.txt

And voila! You now have a tab delimited file you can drop into your favorite spreadsheet program to generate the necessary statistics.

Copyright © 2024 Performance Zen

Theme by Anders NorenUp ↑