
 I deleted Chrome 2.0 from my system on Friday for one very powerful reason: When it is installed, it makes itself the default browser.
Its performance gains and light weight were impressive. But its invasion of my system was uncalled for.
No matter which browser you set to be the default browser, Chrome 2.0 prevents that browser from regaining control. If you click a link in another program, Chrome launches, even if you set MSIE or Firefox or Safari as the default browser.
I thought that kind of behavior was behind browser manufacturers.
Month: March 2009
The Rise of MSIE 8

In the 10 days since its public release, MSIE8 has made a run up the charts. Courtesy of the great folks at StatCounter and their public analytics data, this growing browser share for MSIE8 can be easily followed.
In the US, prior to its release, MSIE8 RC1 was in sixth position behind even the old battleship Firefox 2.0, but ahead of Chrome 1.0.
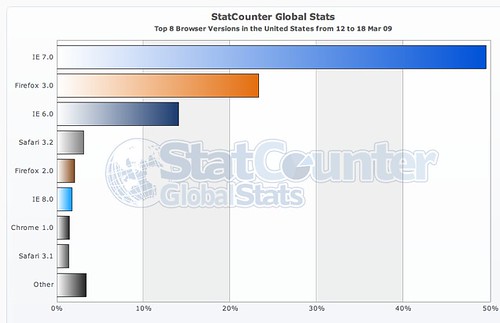
In the week following its release, MSIE has quickly surpassed Firefox 2.0 browser share in the US. I am not really sure who these Firefox 2.0 users are, but they and the MSIE6 users must be found and encouraged to immediately upgrade.
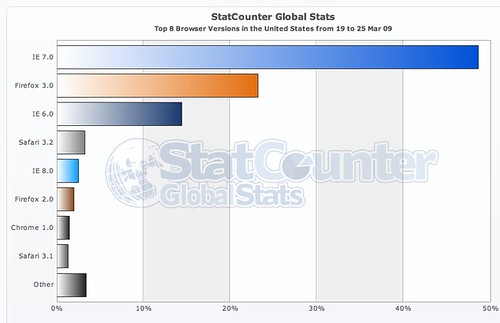
The values for the first week don’t tell the entire story. As it enters its second week of general availability, MSIE8 continues to increase its share of the browser market, moving into fourth place in StatCounters US stats, overtaking Safari 3.2.
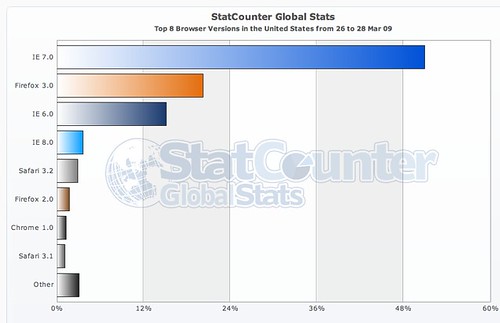
What does t his mean? While it still has a long way to go before it comes close to approaching even the dinosaur, MSIE6, it has to be said that this growth in MSIE8 browser share has occurred without the use of Windows Update. People are making a conscious decision to switch to and use MSIE8.
Site and application designers will need to take heed – MSIE8 compatibility initiatives will have to be in place yesterday rather than some vague time in the future.
Web Performance: The Rise of Browser Computing
 The next generation of browser all tout that they are able to more effectively deliver on the concept of cloud computing and Web applications. That may be the case, but it changes the entire world of Web performance measurement and monitoring.
The Web performance focus for most firms is simple: How quickly can code/text/images/flash can be transferred to the desktop?
The question that needs to be asked now is: What effect does my content have on the browser and the underlying OS when it arrives at the desktop?
Emphasis is now put on the speed and efficiency of Web pages inside browsers. How much CPU/RAM does the browser consume? Are some popular pages more efficient than others? Does continuous use of a browser for 8-12 hours a day cripple a computers ability to do other tasks?
The performance measurement will include instrumenting of the browser. This will not be to capture the content performance, but the browser performance. Through extensions, plugins, accelerators, whatever browsers will be able to report the effect of long-term use of the health of the computer and how it degrades the perceived performance over time.
Many solutions for page-performance tracking have been implemented using JavaScript tags, etc. What would be interesting to many developer is to see the long-term effects of the Web on certain browsers. This information could be tagged with specific event markers, DOM events, plugin usage (Flash, Silverlight, Java), and other items that indicate what events truly effect the browser.
Most browsers provide users and developers tools to debug pages. But what if this data was made globally available? What would it tell us about the containers we use to interact with our world?
GrabPERF Updates being planned – Hostname Resolution Data

Tonight, I figured out how to add the Resolved IP Addresses for a host to measurement data and store that information for further debugging. It was very simple – I was trying to find complex solutions to this issue.
Turns out the solution is built right into PERL: The Socket module.
My thought is that I will update the table with the test config with three new columns:
- HTTPS/HTTP
- Hostname
- Page information
There will likely be a new table that joins with the raw data on
- Date
- Agent_id
- Test_id
And contains a comma-delimited list of all the IP addresses that the agent resolved the hostname to at the test time. This lookup will be run after the measurement, so the DNS lookup component of the measurement is not compromised.
I don’t have an ETA on this, as I want to test it fairly thoroughly before I expose the data. Adding the columns to the test config table will be transparent, but agent modification will need to be verified and then rolled out to all of the folks hosting measurement locations.
What problem does this provide a solution to?
It is vital for firms who use geographic load balancing and CDNs to verify that their data is being served from location appropriate IP addresses. I will be able to tie the information collected here into the IP-Location data I collect for other purposes and help companies ensure that this is being done.
Legitimate DNS Hijacking and You
 DNS hijacking is an occurrence that sends fear into the hearts of man and beast. It takes a perfectly harmless (yet critical) process and turns it into a weapon for chaos and mayhem.
This tool, however, does not simply reside in the hands of people looking to maliciously redirect traffic for purposes I can’t quite fathom – I’ll admit, there is still some simple naivete in my Canadian mind.
Legitimate companies, ISPs, service providers also have this tool at their disposal for their own purposes. An useful and accepted version of this exists already in the form of content delivery networks (CDNs) and other third-parties who take a portion of a companies domain name space and use it to deliver distributed edge content and computing, web analytics, or advertising services.
But let’s move this inside the firewall or into the consumer ISP space. These companies provide DNS for millions of customers. As a result, they could easily re-write DNS entries to reflect their own needs rather than those of the consumer.
In the case of corporate IT networks, there is not much that can be done – they own the wire, hardware and software being used, so they will claim it’s part of the corporate IT policy that all employees sign and that will be that.
Consumers, on the other hand, should expect free and unencumbered access to the worldwide DNS network, without being intercepted or redirected by their own ISPs. And there is frankly no way to verify that this is not happening unless you run your own caching BIND server on your home network.
The alternate is to use one of the external third-party services (OpenDNS or DNS Advantage). But these services also provide Phishing and Filtering services, which means that they can easily modify and redirect an incoming request using the most basic and critical service on the Internet.
While this may sound like the rant of a paranoid, it is a concept that has practical consequences. As an organization, how do you know that you aren’t on the DNS filter list of these providers, or the ISPs? If they can filter and redirect DNS requests, what else are they doing with the information? Are they providing open and trusted access to the core DNS services of the Internet?
Stepping back as far as you can into the process of going to your favorite pages, you will find that you can’t get there without DNS. And if DNS can no longer be trusted, even from legitimate providers, the entire basis of the Internet dissolves.
GrabPERF Agent Update – DNS

This afternoon, the two GrabPERF Agents at Technorati were switched back to using their local copies of caching BIND for resolving DNS entries.
Some folks at Microsoft who stopped by to look at their results on the Search Performance Index noticed that there were one or two outliers in the results from these locations. When I investigated, the OpenDNS name servers I was using were returning odd results.
The reason I had been using OpenDNS is that the local BIND instances were seeing unusual behavior a few months back. So, consider the switch to the local BIND instances probational, pending ongoing review.
Thanks to Eric Schurman for letting me know.
Browsers and Affect on Revenue
A great follow-up to my post on Browser Stats is this slide deck from Gomez on Online Revenue and Browsers Performance.
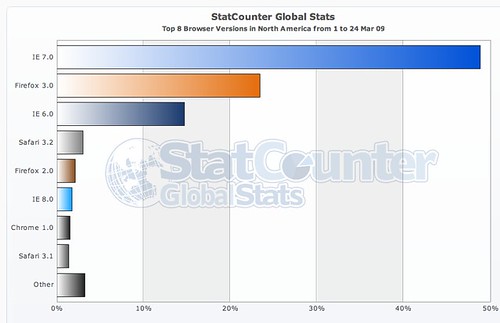
StatCounter Browser Stats – March 1-24 2009
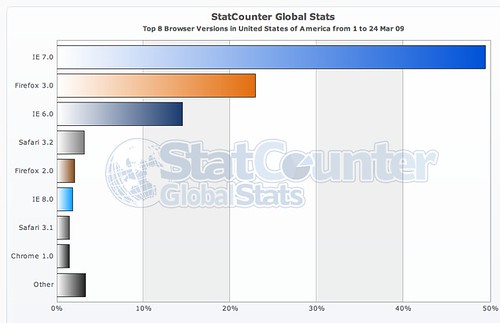
Using the visitor trending data collected and shared by StatCounter, I have undertaken a general analysis of browser distribution by global region. These metrics are collected using the embedded tags that StatCounter customers embed on their site to collect visitor metrics for their own use.
US data shows that MSIE 7.0 is in a dominant position, with Firefox 3.0 in the 25% range of market share. This trend extends into the North American data, which is heavily influenced by the US trend.
MSIE 8.0, still reports a lower distribution than Firefox 2.0. This data is most likely based on the usage of MSIE 8.0 RC1 version, as MSIE 8.0 was only released in GA last week. It is highly probable that these stats will change in the very near future with the release of MSIE 8.0 to Windows Update.
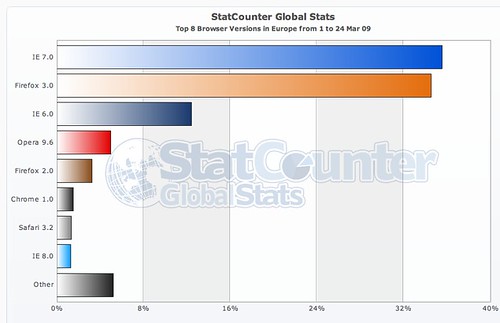
In the EU, where fear and loathing of Microsoft runs deep and true, Firefox 3.0 is approaching parity with MSIE 7.0. Also, the perennially favoured native son Opera makes a very strong showing with their 9.6 release.
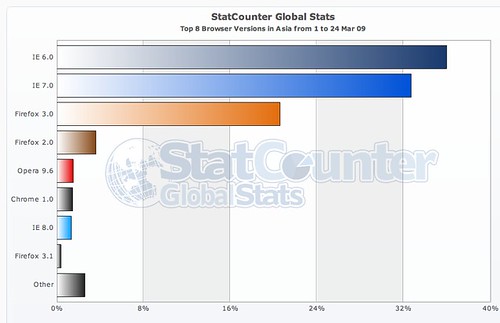
Asia is a Web designers nightmare, with MSIE 6.0 continuing to be the most reported browser. This is concerning, not simply for design reasons, but for web compliance reasons. Effectively Asia has throttled Web development to an old warhorse, but to such a degree that there must be some overriding advantage to using this browser.
As an example, the statistical comparison of four Asia nations is broken out below. We’ll start with Japan where MSIE 7.0 has a clear lead in the statistics.
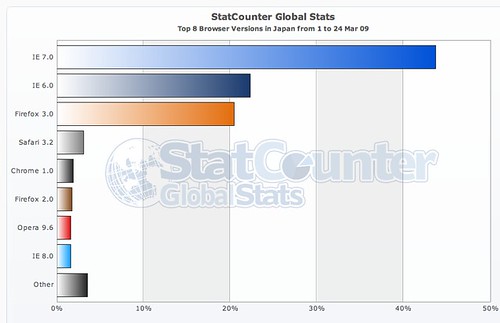
However, when China (People’s Republic), India, and South Korea are added into the analysis, the pull towards MSIE 6.0 is massive.
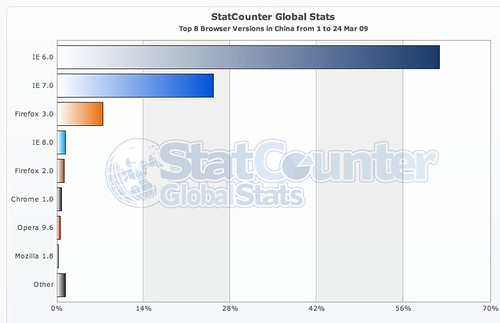
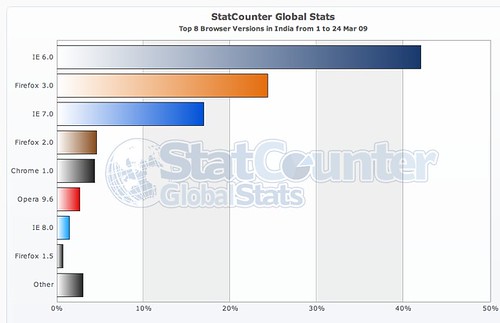
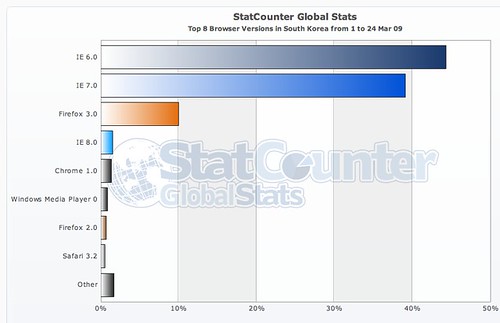
This trend needs to be studied in greater detail in order to understand why MSIE 6.0 is so popular. Is it because of licensing? Continued use of Windows 2000? Compromised computers? The data doesn’t provide any clear or compelling reason for this trend.
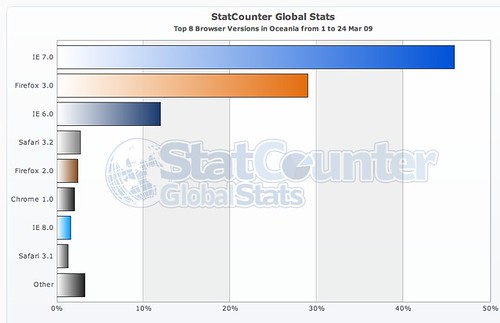
Moving to Oceania shows a return to the trend of MSIE 7.0 being the predominant browser with Firefox in second place, with these two browsers showing a substantial lead over the remaining field.
South America sees MSIE 7.0 as having the largest market share, followed by MSIE 6.0 and Firefox 3.0. Effectively there are no other browsers with substantial market share at present.
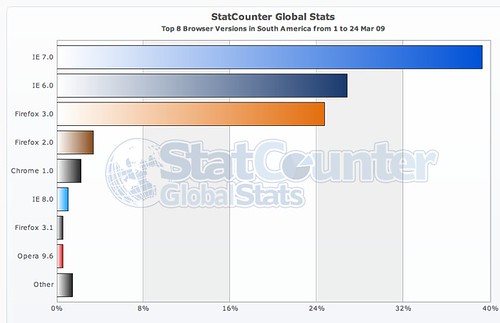
These statistics show that the three most dominant browser platforms by market share are the two MSIE platforms followed by Firefox 3.0. This is likely to change with the MSIE 8.0 GA last week and its predicted release to the masses via Windows Update in the near future.
However, the release of MSIE 8.0 may not be as exponential as is predicted. Corporate IT policies, which have been slow to embrace MSIE 7.0, are likely not going to make a giant leap to MSIE 8.0 overnight. Adoption among the general population will also depend on the ability of existing Web applications to adapt to a more standards-compliant browser platform.
Noticeably absent from most of these statistics is Safari in a position to challenge the three leading browsers. This indicates that even hardcore Mac users continue to use Firefox as their primary Web application and browsing platform. StatCounter backs this up by indicating that within their data, 8.36% of visitors from the USA were on Macs, while 3.15% of visitors used Safari.
Trends to watch in the near future:
- New browser releases (Firefox 3.1, Safari 4.0) and their effect on browser distribution
- Uptake of MSIE 8.0 once it is released via Windows Update
- Browser distribution is Asia
Search Referrer Stats – March 21 2009
Via Statcounter, here is my search engine distribution for a log of 2,000 hits.
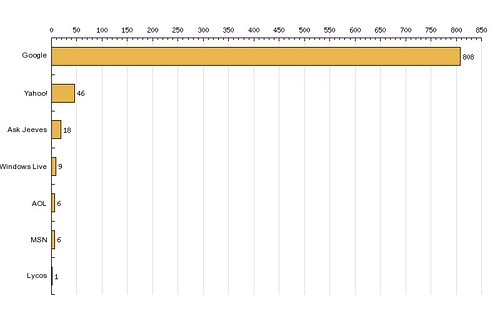
With statistics like these, is there really any point in having other search engines?
GrabPERF Search Index – March 13-19 2009
 About four years ago, I published/posted a number of indices related to GrabPERF data. This is a re-launch of that, starting with the GrabPERF Search Performance Index.
The methodology of the Search Performance Index is straightforward: A number of key search providers are selected and HTTP GET requests are sent that directly pull the results page of a query page that is searching for ‘New York’.
This is a simple process and one that is a close approximation of the actual search process that hundreds of millions of people perform every day.
alias                       Response Time  Success  Attempts  Success Rate
--------------------------  -------------  -------  --------  ------------
SEARCH - Google Blogsearch      0.2822545    27242     27244       99.9927
SEARCH - Google                 0.3151932    27228     27247       99.9303
SEARCH - Live (Microsoft)       0.3840097    27245     27246       99.9963
SEARCH - Indeed                 0.4112960    27240     27241       99.9963
SEARCH - Yahoo                  0.4574381    24175     24175      100.0000
SEARCH - Altavista              0.4592764    23922     23922      100.0000
SEARCH - Cuil                   0.6757475    23963     23967       99.9833
SEARCH - AOL                    0.7822945    23913     23913      100.0000
SEARCH - Ask                    0.9025220    24157     24163       99.9752
SEARCH - Technorati             0.9053472    27219     27234       99.9449
SEARCH - Amazon                 1.3251402    27245     27251       99.9780
SEARCH - Baidu                  1.7409345    23777     23799       99.9076
SEARCH - Blogdigger             1.8960633    25106     26354       95.2645
SEARCH - BlogLines              2.0238809    27233     27248       99.9450
SEARCH - IceRocket              2.1233684    24147     24177       99.8759
SEARCH - Blogpulse              2.4144131    27019     27247       99.1632
As can be seen in the data, there is a substantial degree of difference in the response time results, but the big three search providers (Google, Yahoo, and Microsoft Live) were in the top five. As well, all but three of the providers (Blogdigger, IceRocket and Blogpulse) had success rates (availability) of 99.9% or higher.
I don’t expect to see much in the way of change in these results, but I will post them for comparison each week.