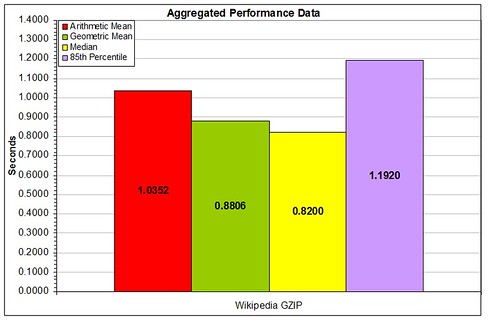
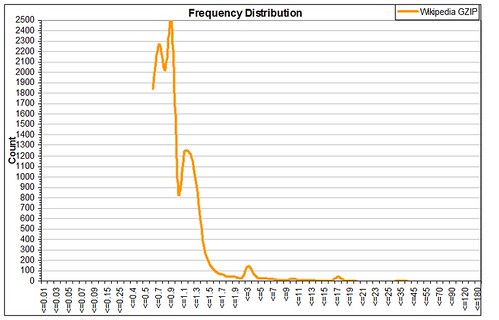
 While this post is aimed at Web performance, the curse of the single metric affects our everyday lives in ways that we have become oblivious to.
When you listen to a business report, the stock market indices are an aggregated metric used to represent the performance of a set group of stocks.
When you read about economic indicators, these values are the aggregated representations of complex populations of data, collected from around the country, or the world.
Sport scores are the final tally of an event, but they may not always represent how well each team performed during the match.
The problem with single metrics lies in their simplicity. When a single metric is created, it usually attempts to factor in all of the possible and relevant data to produce an aggregated value that can represent a whole population of results.
These single metrics are then portrayed as a complete representation of this complex calculation. The presentation of this single metric is usually done in such a way that their compelling simplicity is accepted as the truth, rather than as a representation of a truth.
In the area of Web performance, organizations have fallen prey to this need for the compelling single metric. The need to represent a very complex process in terms that can be quickly absorbed and understand by as large a group of people as possible.
The single metrics most commonly found in the Web performance management field are performance (end-to-end response time of the tested business process) and availability (success rate of the tested business process). These numbers are then merged and transformed by data from a number of sources (external measurements, hit counts, conversions, internal server metrics, packet loss), and this information is bubbled up in an organization. By the time senior management and decision-makers receive the Web performance results, that are likely several steps removed from the raw measurement data.
An executive will tell you that information is a blessing, but only when it speeds, rather than hinders, the decision-making process. A Web performance consultant (such as myself) will tell that basing your decisions on a single metric that has been created out of a complex population of data is madness.
So, where does the middle-ground lie between the data wonks and the senior leaders? The rest of this post is dedicated to introducing a few of the metrics that will, in a small subset of metrics, give a senior leaders better information to work from when deciding what to do next.
A great place to start this process is to examine the percentile distribution of measurement results. Percentiles are known to anyone who has children. After a visit to the pediatrician, someone will likely state that “My son/daughter is in the XXth percentile of his/her age group for height/weight/tantrums/etc”. This means that XX% of the population of children that age, as recorded by pediatricians, report values at or below the same value for this same metric.
Percentiles are great for a population of results like Web performance measurement data. Using only a small set of values, anyone can quickly see how many visitors to a site could be experiencing poor performance.
If at the median (50th percentile), the measured business process is 3.0 seconds, this means that 50% of all of the measurements looked at are being completed in 3.0 seconds or less.
If the executive then looks up to the 90th percentile and sees that it’s at 16.0 seconds, it can be quickly determined that something very bad has happened to affect the response times collected for the 40% of the population between these two points. Immediately, everyone knows that for some reason, an unacceptable number of visitors are likely experiencing degraded and unpredictable performance when they visit the site.
A suggestion for enhancing averages with percentiles is to use the 90th percentile value as a trim ceiling for the average. Then side-by-side comparisons of the untrimmed and trimmed averages can be compared. For sites with a larger number of response time outliers, the average will decrease dramatically when it is trimmed, while sites with more consistent measurement results will find their average response time is similar with and without the trimmed data.
It is also critical to examine the application’s response times and success rates throughout defined business cycles. A single response time or success rate value eliminates
- variations by time of day
- variations by day of week
- variations by month
- variations caused by advertising and marketing
An average is just an average. If at peak buiness hours, response times are 5.0 seconds slower than the average, then the average is meaningless, as business is being lost to poor performance which has been lost in the focus on the single metric.
All of these items have also fallen prey to their own curse of the single metric. All of the items discussed above aggregate the response time of the business process into a single metric. The process of purchasing items online is broken down into discrete steps, and different parts of this process likely take longer than others. And one step beyond the discrete steps are the objects and data that appear to the customer during these steps.
It is critical to isolate the performance for each step of the process to find the bottlenecks to performance. Then the components in those steps that cause the greatest response time or success rate degradation must be identified and targeted for performance improvement initiatives. If there are one or two poorly performing steps in a business process, focusing performance improvement efforts on these is critical, otherwise precious resources are being wasted in trying to fix parts of the application that are working well.
In summary, a single metric provides a sense of false confidence, the sense that the application can be counted on to deliver response times and success rates that are nearly the same as those simple, single metrics.
The average provides a middle ground, a line that says that is the approximate mid-point of the measurement population. There are measurements above and below this average, and you have to plan around the peaks and valleys, not the open plains. It is critical never to fall victim to the attractive charms that come with the curse of the single metric.

