
A great follow-up to my post on Browser Stats is this slide deck from Gomez on Online Revenue and Browsers Performance.
Author: spierzchala
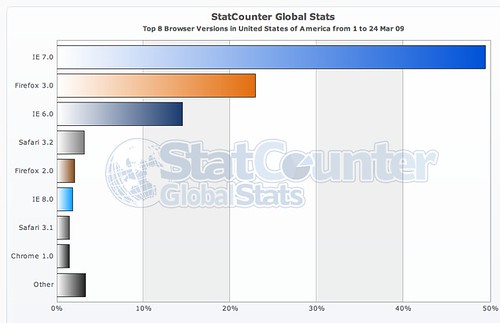
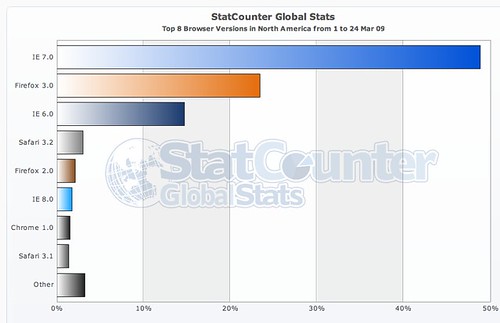
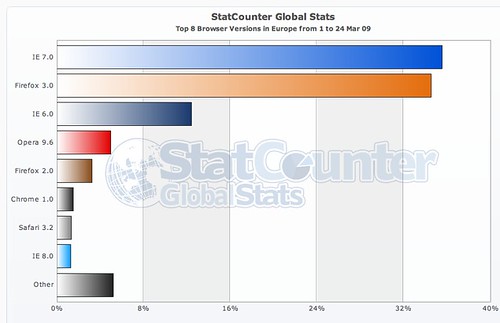
StatCounter Browser Stats – March 1-24 2009
Using the visitor trending data collected and shared by StatCounter, I have undertaken a general analysis of browser distribution by global region. These metrics are collected using the embedded tags that StatCounter customers embed on their site to collect visitor metrics for their own use.
US data shows that MSIE 7.0 is in a dominant position, with Firefox 3.0 in the 25% range of market share. This trend extends into the North American data, which is heavily influenced by the US trend.
MSIE 8.0, still reports a lower distribution than Firefox 2.0. This data is most likely based on the usage of MSIE 8.0 RC1 version, as MSIE 8.0 was only released in GA last week. It is highly probable that these stats will change in the very near future with the release of MSIE 8.0 to Windows Update.
In the EU, where fear and loathing of Microsoft runs deep and true, Firefox 3.0 is approaching parity with MSIE 7.0. Also, the perennially favoured native son Opera makes a very strong showing with their 9.6 release.
Asia is a Web designers nightmare, with MSIE 6.0 continuing to be the most reported browser. This is concerning, not simply for design reasons, but for web compliance reasons. Effectively Asia has throttled Web development to an old warhorse, but to such a degree that there must be some overriding advantage to using this browser.
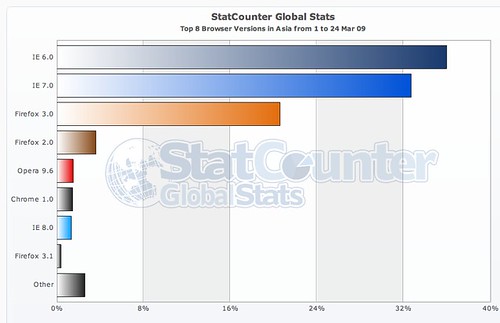
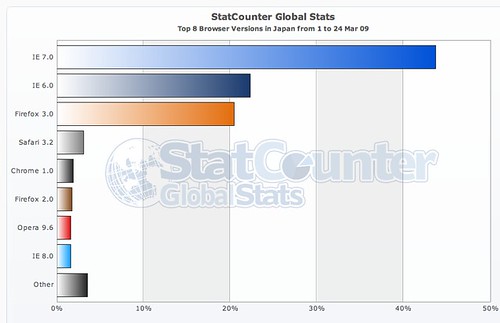
As an example, the statistical comparison of four Asia nations is broken out below. We’ll start with Japan where MSIE 7.0 has a clear lead in the statistics.
However, when China (People’s Republic), India, and South Korea are added into the analysis, the pull towards MSIE 6.0 is massive.
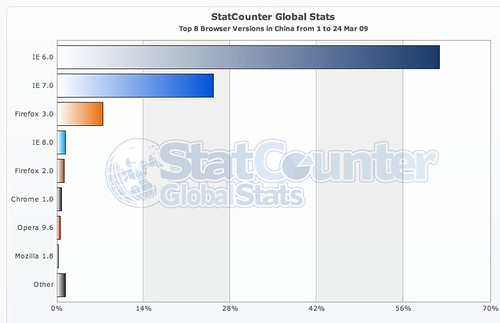
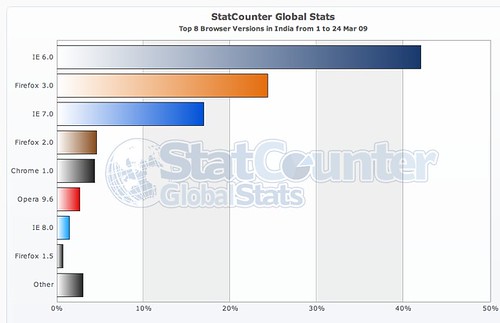
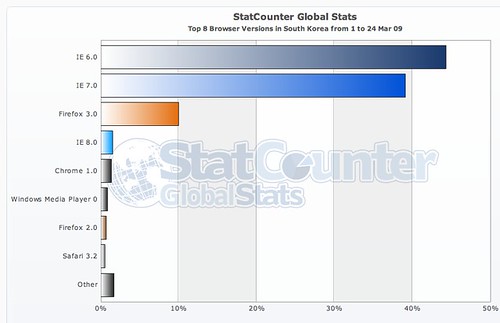
This trend needs to be studied in greater detail in order to understand why MSIE 6.0 is so popular. Is it because of licensing? Continued use of Windows 2000? Compromised computers? The data doesn’t provide any clear or compelling reason for this trend.
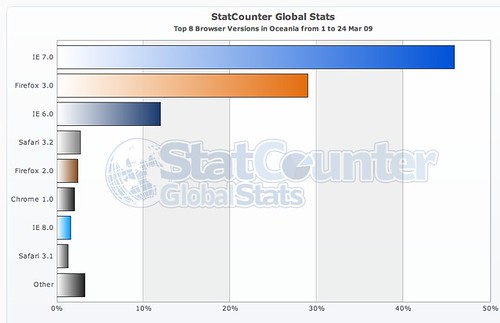
Moving to Oceania shows a return to the trend of MSIE 7.0 being the predominant browser with Firefox in second place, with these two browsers showing a substantial lead over the remaining field.
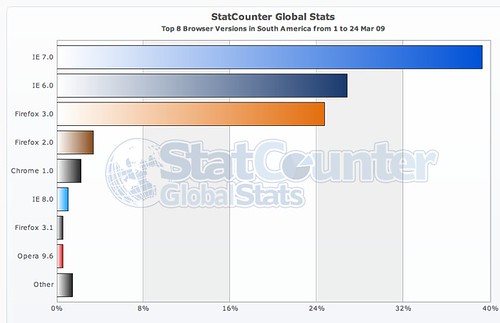
South America sees MSIE 7.0 as having the largest market share, followed by MSIE 6.0 and Firefox 3.0. Effectively there are no other browsers with substantial market share at present.
These statistics show that the three most dominant browser platforms by market share are the two MSIE platforms followed by Firefox 3.0. This is likely to change with the MSIE 8.0 GA last week and its predicted release to the masses via Windows Update in the near future.
However, the release of MSIE 8.0 may not be as exponential as is predicted. Corporate IT policies, which have been slow to embrace MSIE 7.0, are likely not going to make a giant leap to MSIE 8.0 overnight. Adoption among the general population will also depend on the ability of existing Web applications to adapt to a more standards-compliant browser platform.
Noticeably absent from most of these statistics is Safari in a position to challenge the three leading browsers. This indicates that even hardcore Mac users continue to use Firefox as their primary Web application and browsing platform. StatCounter backs this up by indicating that within their data, 8.36% of visitors from the USA were on Macs, while 3.15% of visitors used Safari.
Trends to watch in the near future:
- New browser releases (Firefox 3.1, Safari 4.0) and their effect on browser distribution
- Uptake of MSIE 8.0 once it is released via Windows Update
- Browser distribution is Asia
Search Referrer Stats – March 21 2009
Via Statcounter, here is my search engine distribution for a log of 2,000 hits.
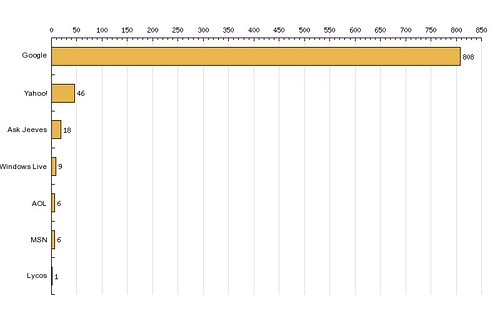
With statistics like these, is there really any point in having other search engines?
GrabPERF Search Index – March 13-19 2009
 About four years ago, I published/posted a number of indices related to GrabPERF data. This is a re-launch of that, starting with the GrabPERF Search Performance Index.
The methodology of the Search Performance Index is straightforward: A number of key search providers are selected and HTTP GET requests are sent that directly pull the results page of a query page that is searching for ‘New York’.
This is a simple process and one that is a close approximation of the actual search process that hundreds of millions of people perform every day.
alias                       Response Time  Success  Attempts  Success Rate
--------------------------  -------------  -------  --------  ------------
SEARCH - Google Blogsearch      0.2822545    27242     27244       99.9927
SEARCH - Google                 0.3151932    27228     27247       99.9303
SEARCH - Live (Microsoft)       0.3840097    27245     27246       99.9963
SEARCH - Indeed                 0.4112960    27240     27241       99.9963
SEARCH - Yahoo                  0.4574381    24175     24175      100.0000
SEARCH - Altavista              0.4592764    23922     23922      100.0000
SEARCH - Cuil                   0.6757475    23963     23967       99.9833
SEARCH - AOL                    0.7822945    23913     23913      100.0000
SEARCH - Ask                    0.9025220    24157     24163       99.9752
SEARCH - Technorati             0.9053472    27219     27234       99.9449
SEARCH - Amazon                 1.3251402    27245     27251       99.9780
SEARCH - Baidu                  1.7409345    23777     23799       99.9076
SEARCH - Blogdigger             1.8960633    25106     26354       95.2645
SEARCH - BlogLines              2.0238809    27233     27248       99.9450
SEARCH - IceRocket              2.1233684    24147     24177       99.8759
SEARCH - Blogpulse              2.4144131    27019     27247       99.1632
As can be seen in the data, there is a substantial degree of difference in the response time results, but the big three search providers (Google, Yahoo, and Microsoft Live) were in the top five. As well, all but three of the providers (Blogdigger, IceRocket and Blogpulse) had success rates (availability) of 99.9% or higher.
I don’t expect to see much in the way of change in these results, but I will post them for comparison each week.
MSIE8 QOTD and other browser war comments
Here’s what the difference between the companies boils down to: Microsoft is focusing on today’s Web, and the rivals are focusing on tomorrow’s.
Stephen Shankland via Browser war centers on once-obscure JavaScript
This sums up many of the comments that I have made about browsers over the months [see Does the browser really matter?]. The browser is not a passive browser any more. It is a Web application portal/container. With MSIE8, Microsoft has not made the leap into the future web.
It has produced more of the same, and will likely continue to see its percentage of the market drop, at least until Windows 7 rolls with MSIE8 installed as the base browser.
My final comment is that Windows 7 may not be enough to save Microsoft entirely due to the economic downturn and its effect on the upgrade process within households and corporations.
Internet Explorer 8 – Coming to a Site Near You!
 Tomorrow morning, at 09:00 PDT, Microsoft unleashes IE 8.0 on an unsuspecting Internet.
By 12:00 PDT, the number of Web sites having to put up IE 7.0 only stickers will be in the millions.
I haven’t done a lot of testing of the new monster (I mainly use Firefox on Mac OS 10.5.6), but it doesn’t seem any weirder than any of the other Microsoft browsers I have used.
Under the hood, it does amp up the number of connections that are used to download objects, but if your infrastructure is prepared, it should be no big deal.
The big concern lies in the rendering. If those users who can upgrade to the new browser (anyone not limited to IE 6 by a corporate IT policy written on parchment) do find there are problems, will they blame the site or the browser?
Have you tested your site to ensure that it actually works with IE 8? Or will you get burned?
What is the greatest benefit you see to your visitors having IE 8 instead of IE 6 or 7?
Is this a good thing?
Modern Business and the Culture of Assurance

I often wonder how much business is lost but the levels of assurance that exist within modern companies.
As information passes through and upward through a company, it is filtered, shaped, refined down to the one salient decision point that all the executives can then discuss. The concern that I have is whether the devolution of detail within organizations stifles their ability to innovate, especially in times of stress.
Small companies have a short distance from those that create and work with the product to the senior levels. As a result, senior managers and executives are tightly tied to the details of the product, of the company, of the customers. They understand that details are important.
Mature companies discuss how their strategies and initiatives will shape an entire industry and change the way everyone does business. But how that happens is often lost as those concepts flow downward. Just as detail devolves on the way up, detail evolves on the way down.
It is nigh on impossible to participate in an industry-defining paradigm shift when your everyday activities double and triple, leading to a complete dissociation between the executive level and the worker level.
Why does this occur?
Its not that detail devolves on the way up an organization, but rather that each level needs to assure each higher level that everything is ok and that solutions can be found for those issues that may be challenging, so lets just keep pressing forward.
So the devolution of detail coupled with the culture of assurance gets too many companies in trouble.
The devil is in the details. And sometimes, the devil can be your friend.
Misuse of Round-Robin DNS
This is a “re-print” of an article I had on Webperformance.org that I notice that a number of people search for.

See additional information on how not to use Round-Robin DNS.
The use of Round-Robin DNS for load-balancing has been around for a number of years. It is meant to serve as a way to have multiple hosts with different IP addresses represent the sam hostname. It is useful, but as dedicated load-balancing technology began to evolve, its use began to decrease, as it was not sensitive to the conditions that exist within a server-farm; it simply told clients which IP they should connect to, without any consideration of the condition of the server they were connecting to.
Recently, I have seen a few instances where companies have switched back to Round-Robin DNS without considering the pitfalls and limitations of this particular method of load-balancing. The most dangerous of these is the limitation, set out in RFC 1035, that a DNS message carried in UDP cannot exceed 512 bytes.
2.3.4. Size limits
Various objects and parameters in the DNS have size limits.  They are
listed below.  Some could be easily changed, others are more
fundamental.
labels          63 octets or less
names           255 octets or less
TTL             positive values of a signed 32 bit number.
UDP messages    512 octets or less
When a UDP DNS message exceeds 512 octets/bytes, the TRUNCATED bit is included in the response, indicating to the client/resolver that not all of the answers were returned, and they should re-query using a TCP DNS message.
It’s the final phrase of the previous paragraph that should set everyone’s ears a-twitter: the only thing that should be requested using TCP DNS messages are zone transfers between servers. If a someone who is not one of your authorized servers is attempting to connect using TCP to port 53 of your DNS server, they may be attempting to do an illegal zone transfer of your domain information.
As a result, TCP connections to port 53 are usually blocked inbound (and outbound, if you run an ISP and you assume your users are up to no good). So, guess what happens when the truncated DNS information is re-requested over TCP? Web performance is negatively affected by between 21 and 93 seconds.[1]
So, simply put, DNS information needs to be tightly managed and examined, to ensure that only the most appropriate information sent out when a DNS query arrives. Using Round-Robin DNS to load-balance more than 5 servers indicates that you should be examining other load-balancing schemes.
24 April 2003 — Round-Robin Authority Records
This morning, I spoke with a client who was experiencing extremely variable DNS lookup times on their site after they implemented a new architecture. This architecture saw them locate a full mirror of the production site in Europe, for any potential failover situations.
This looks good on paper — apparently the project plan ran to eleven pages — but they made one very serious technical faux pas: they deployed two of the authoritative name servers in the UK.
The DNS gurus in the audience are saying “So what?”. This is because when you set up 4 authoritative DNS servers correctly, the query is sent to all 4 simultaneously and the one with the fastest response time is used. This usually results from the following type of configuration:
		dns1.foobar.com		10.128.6.2
		dns2.foobar.com		10.128.17.2
		ns0.snafubar.com	172.16.12.2
		ns-ext.barfoo.net	10.250.32.128
The client this morning, however, had a very different type of configuration.
		dns.foobar.com		10.128.6.2
		dns.foobar.com		10.128.6.4
		dns.foobar.com		172.16.12.2
		dns.foobar.com		172.16.12.4
When the authority record is returned in this fashion, the results are easily understood. The host name is the same for all four IP addresses, so the querying name server does what it is supposed to do in these situations: resort to the Round-RObin algorithm. Instead of querying all four name servers simultaneously, the querying name server rotates through the authoritative names.
Depending on where the authoritative name servers are located, the DNS lookup time could vary wildly. In the case of the client this morning, 50% of the DNS lookups were being routed to the UK, regardless of where the querying name server was located.
[1] This value varies depending on the operating system. For Windows 2000, the TCP timeout is 21 seconds; for Linux, this value is 93 seconds.
New Domains Pointed to Newest Industry
 For a number of years, I have owned three very popular domain names: WebPerformance.org, WebCaching.org, and WebCompression.org. Last night, after many days of consideration, I stopped pointing them at their own distinct Web space and pointed them at this blog.
This is not a bad or evil thing, considering that for at least 18 months, the articles that were hosted at those sites were duplicated here in a more manageable format.
For those who have come looking for the content from those sites, it is here. The search box in the right column can help you locate it.
But for those who would like a refresher, here is a list of the most popular articles on this blog, as selected by Web performance traffic.
Web Performance Concepts Series
- Web Performance, Part I: Fundamentals
- Web Performance, Part II: What are you calling ‘average’?
- Web Performance, Part III: Moving Beyond Average
- Web Performance, Part IV: Finding The Frequency
- Web Performance, Part V: Baseline Your Data
- Web Performance, Part VI: Benchmarking Your Site
- Web Performance, Part VII: Reliability and Consistency
- Web Performance, Part VIII: How do you define fast?
- Web Performance, Part IX: Curse of the Single Metric
Why Web Measurement Series
- Why Web Measurement, Part I: Customer Generation
- Why Web Measurement, Part II: Customer Retention
- Why Web Measurement, Part III: Business Operations
- Why Web Measurement, Part IV: Technical Operations
Web Performance Tuning
- The Dichotomy of the Web: Andy King’s Website Optimization
- Performance Improvement From Compression
- Baseline Testing With cURL
- Compressing Web Output Using mod_deflate and Apache 2.0.x
- Compressing PHP Output
- Using Client-Side Cache Solutions And Server-Side Caching Configurations To Improve Internet Performance
- Performance Improvement From Caching and Compression
- Compressing Web Output Using mod_gzip for Apache 1.3.x and 2.0.x
- mod_gzip Compile Instructions
- Hacking mod_deflate for Apache 2.0.44 and lower
IP Tracking
GrabPERF – Search Performance Index
 Today I would like to announce the availability of the GrabPERF Search Performance Index.
The goal of the index is to provide performance metrics for a group of search providers around the world. The results are based on a direct HTTP GET request being made for the search results page by the GrabPERF Agent.
Currently only live data is available. In the near future, archival results on a week by week basis will be made available.
If there is a search provider that has been missed, please contact the GrabPERF team.