Tag: Business of web performance

Web Performance: Managing Web Performance Improvement

When starting with new clients, finding the low-hanging fruit of Web performance is often the simplest thing that can be done. By recommending a few simple configuration changes, these early stage clients can often reap substantial Web performance improvement gains.

The harder problem is that it is hard for organizations to build on these early wins and create an ongoing culture of Web performance improvement. Stripping away the simple fixes often exposes deeper, more base problems that may not have anything to do with technology. In some cases, there is no Web performance improvement process simply because of the pressure and resource constraints that are faced.

In other cases, a deeper, more profound distrust between the IT and Business sides of the organization leads to a culture of conflict, a culture where it is almost impossible to help a company evolve and develop more advanced ways of examining the Web performance improvement process.

I have written on how Business and IT appear, on the surface, to be a mutually exclusive dichotomy in my review of Andy King’s Website Optimization. But this dichotomy only exists in those organizations where conflict between business and technology goals dominate the conversation. In an organization with more advanced Web performance improvement processes, there is a shared belief that all business units share the same goal.

So how can a company without a culture of Web performance improvement develop one?

What can an organization crushed between limited resources and demanding clients do to make sure that every aspect of their Web presence performs in an optimal way?

How can an organization where the lack of transparency and the open distrust between groups evolve to adopt an open and mutually agreed upon performance improvement process? Experience has shown me that a strong culture of Web performance improvement is built on three pillars: Targets, Measurements, and Involvement.

Targets

Setting a Web performance improvement target is the easiest part of the process to implement. it is almost ironic that it is also the part of the process that is the most often ignored.

Any Web performance improvement process must start with a target. It is the target that defines the success of the initiative at the end of all of the effort and work.

If a Web performance improvement process does not have a target, then the process should be immediately halted. Without a target, there is no way to gauge how effective the project has been, and there is no way to measure success.

Measurements

Key to achieving any target is the ability to measure the success in achieving the target. However, before success can be measured, how to measure success must be determined. There must be clear definitions on what will be measured, how, from where, and why the measurement is important.

Defining how success will be measured ensures transparency throughout the improvement process. Allowing anyone who is involved or interested in the process to see the progress being made makes it easier to get people excited and involved in the performance improvement process.

Involvement

This is the component of the Web performance improvement process that companies have the greatest difficulty with. One of the great themes that defines the Web performance industry is the openly hostile relationships between IT and Business that exist within so many organizations. The desire to develop and ingrain a culture of Web performance improvement is lost in the turf battles between IT and Business.

If this energy could be channeled into proactive activity, the Web performance improvement process would be seen as beneficial to both IT and Business. But what this means is that there must be greater openness to involve the two parts of the organization in any Web performance improvement initiative.

Involving as many people as is relevant requires that all parts of the organization agree on how improvement will be measured, and what defines a successful Web performance improvement initiative.

Summary

Targets, Measurements, and Involvement are critical to Web performance initiatives. The highly technical nature of a Web site and the complexities of the business that this technology supports should push companies to find the simplest performance improvement process that they can. What most often occurs, however, is that these three simple process management ideas are quickly overwhelmed by time pressures, client demands, resource constraints, and internecine corporate warfare.

Web Performance: Blogs, Third Party Apps, and Your Personal Brand

The idea that blogs generate a personal brand is as old as the “blogosphere”. It’s one of those topics that rages through the blog world every few months. Inexorably the discussion winds its way to the idea that a blog is linked exclusively to the creators of its content. This makes a blog, no matter what side of the discussion you fall on, the online representation of a personal brand that is as strong as a brand generated by an online business.

And just as corporate brands are affected by the performance of their Web sites, a personal brand can suffer just as much when something causes the performance of a blog Web site to degrade in the eyes of the visitors. For me, although my personal brand is not a large one, this happened yesterday when Disqus upgraded to multiple databases during the middle of the day, causing my site to slow to a crawl.

I will restrain my comments on mid-day maintenance for another time.

The focus of this post is the effect that site performance has on personal branding. In my case, the fact that my blog site slowed to a near standstill in the middle of the day likely left visitors with the impression that my blog about Web performance was not practicing what it preached.

For any personal brand, this is not a good thing.
In my case, I was able to draw on my experience to quickly identify and resolve the issue. Performance returned to normal when I temporarily disabled the Disqus plugin (it has since been reactivated). However, if I hadn’t been paying attention, this performance degradation could have continued, increasing the negative effect on my personal brand.

Like many blogs, Disqus is only one of the outside services I have embedded in my site design. Sites today rely on AdSense, Lookery, Google Analytics, Statcounter, Omniture, Lijit, and on goes the list. These services have become as omnipresent in blogs as the content. What needs to be remembered is that these add-ons are often overlooked as performance inhibitors.

Many of these services are built using the new models of the over-hyped and mis-understood Web 2.0. These services start small, and, as Shel Israel discussed yesterday, need to focus on scalability in order to grow and be seen as successful, rather than cool, but a bit flaky. As a result, these blog-centric services may affect performance to a far greater extent than the third-party apps used by well-established, commercial Web sites.

I am not claiming that any one of these services in and of themselves causes any form of slowdown. Each has its own challenges with scaling, capacity, and success. It is the sheer number of the services that are used by blog designers and authors poses the greatest potential problem when attempting to debug performance slowdowns or outages. The question in these instances, in the heat of a particularly stressful moment in time, is always: Is it my site or the third-party?

The advice I give is that spoken by Michael Dell: You can’t manage what you can’t measure. Yesterday, I initiated monitoring of my personal Disqus community page, so I could understand how this service affected my continuing Web performance. I suggest that you do the same, but not just of this third-party. You need to understand how all of the third-party apps you use affect how your personal brand performance is perceived.

Why is this important? In the mind of the visitor, the performance problem is always with your site. As with a corporate site that sees a sudden rise in response times or decrease in availability, it does not matter to the visitor what the underlying cause of the issue is. All they see is that your site, your brand (personal or corporate), is not as strong or reliable as they had been led to believe.

The lesson that I learned yesterday, one that I have taught to so many companies but not heeded myself, is that monitoring the performance of all aspects of your site is critical. And while you as the blog designer or writer might not directly control the third-party content you embed in your site, you must consider how it affects your personal brand when something goes wrong.

You can then make an informed decision on whether the benefit of any one third-party app is outweighed by the negative effect it has on your site performance and, by extension, your personal brand.

Web Performance, Part IX: Curse of the Single Metric

While this post is aimed at Web performance, the curse of the single metric affects our everyday lives in ways that we have become oblivious to.

When you listen to a business report, the stock market indices are an aggregated metric used to represent the performance of a set group of stocks.

When you read about economic indicators, these values are the aggregated representations of complex populations of data, collected from around the country, or the world.

Sport scores are the final tally of an event, but they may not always represent how well each team performed during the match.

The problem with single metrics lies in their simplicity. When a single metric is created, it usually attempts to factor in all of the possible and relevant data to produce an aggregated value that can represent a whole population of results.
These single metrics are then portrayed as a complete representation of this complex calculation. The presentation of this single metric is usually done in such a way that their compelling simplicity is accepted as the truth, rather than as a representation of a truth.

In the area of Web performance, organizations have fallen prey to this need for the compelling single metric. The need to represent a very complex process in terms that can be quickly absorbed and understand by as large a group of people as possible.

The single metrics most commonly found in the Web performance management field are performance (end-to-end response time of the tested business process) and availability (success rate of the tested business process). These numbers are then merged and transformed by data from a number of sources (external measurements, hit counts, conversions, internal server metrics, packet loss), and this information is bubbled up in an organization. By the time senior management and decision-makers receive the Web performance results, that are likely several steps removed from the raw measurement data.

An executive will tell you that information is a blessing, but only when it speeds, rather than hinders, the decision-making process. A Web performance consultant (such as myself) will tell that basing your decisions on a single metric that has been created out of a complex population of data is madness.

So, where does the middle-ground lie between the data wonks and the senior leaders? The rest of this post is dedicated to introducing a few of the metrics that will, in a small subset of metrics, give a senior leaders better information to work from when deciding what to do next.

A great place to start this process is to examine the percentile distribution of measurement results. Percentiles are known to anyone who has children. After a visit to the pediatrician, someone will likely state that “My son/daughter is in the XXth percentile of his/her age group for height/weight/tantrums/etc”. This means that XX% of the population of children that age, as recorded by pediatricians, report values at or below the same value for this same metric.

Percentiles are great for a population of results like Web performance measurement data. Using only a small set of values, anyone can quickly see how many visitors to a site could be experiencing poor performance.

If at the median (50th percentile), the measured business process is 3.0 seconds, this means that 50% of all of the measurements looked at are being completed in 3.0 seconds or less.

If the executive then looks up to the 90th percentile and sees that it’s at 16.0 seconds, it can be quickly determined that something very bad has happened to affect the response times collected for the 40% of the population between these two points. Immediately, everyone knows that for some reason, an unacceptable number of visitors are likely experiencing degraded and unpredictable performance when they visit the site.

A suggestion for enhancing averages with percentiles is to use the 90th percentile value as a trim ceiling for the average. Then side-by-side comparisons of the untrimmed and trimmed averages can be compared. For sites with a larger number of response time outliers, the average will decrease dramatically when it is trimmed, while sites with more consistent measurement results will find their average response time is similar with and without the trimmed data.

It is also critical to examine the application’s response times and success rates throughout defined business cycles. A single response time or success rate value eliminates

  • variations by time of day
  • variations by day of week
  • variations by month
  • variations caused by advertising and marketing

An average is just an average. If at peak buiness hours, response times are 5.0 seconds slower than the average, then the average is meaningless, as business is being lost to poor performance which has been lost in the focus on the single metric.

All of these items have also fallen prey to their own curse of the single metric. All of the items discussed above aggregate the response time of the business process into a single metric. The process of purchasing items online is broken down into discrete steps, and different parts of this process likely take longer than others. And one step beyond the discrete steps are the objects and data that appear to the customer during these steps.

It is critical to isolate the performance for each step of the process to find the bottlenecks to performance. Then the components in those steps that cause the greatest response time or success rate degradation must be identified and targeted for performance improvement initiatives. If there are one or two poorly performing steps in a business process, focusing performance improvement efforts on these is critical, otherwise precious resources are being wasted in trying to fix parts of the application that are working well.

In summary, a single metric provides a sense of false confidence, the sense that the application can be counted on to deliver response times and success rates that are nearly the same as those simple, single metrics.

The average provides a middle ground, a line that says that is the approximate mid-point of the measurement population. There are measurements above and below this average, and you have to plan around the peaks and valleys, not the open plains. It is critical never to fall victim to the attractive charms that come with the curse of the single metric.

Web Performance, Part VIII: How do you define fast?

In the realm of Web performance measurement and monitoring, one of the eternal and ever-present questions remains “What is fast?”. The simple fact is that there is no single answer for this question, as it it isn’t a question with one quantitative answer that encompasses all the varied scenarios that are presented to the Web performance professional.

The answer that the people who ask the “What is fast?” question most often hear is “It depends”. And in most cases, it depends on the results of three distinct areas of analysis.

  1. Baselining
  2. Competitve Analysis
  3. Comparative Analysis

Baselining

Baselining is the process of examining Web performance results over a period of time to determine the inherent patterns that exist in the measurement data. It is critical that this process occur over a minimum period of 14 days, as there are a number of key patterns that will only appear within a period at least that long.

Baselining also provides some idea of what normal performance of a Web site or Web business process is. While this will provide some insight into the what can be expected from the site, in isolation it provides only a tiny glimpse into the complexity of how fast a Web site should be.

Baselining can identify the slow pages in a business process, or identify objects that may be causing noticeable performance degradation, its inherent isolation from the rest of the world it exists is its biggest failing. Companies that rely only on the performance data from their own sites to provide the context of what is fast are left with a very narrow view of the real world.

Competitive Analysis

All companies have competition. There is always a firm or organization whose sole purpose is to carve a niche out of your base of customers. It flows both ways, as your firm is trying to do exactly the same thing to other firms.

When you consider the performance of your online presence, which is likely accounting for a large (and growing) component of your revenue, why would you leave the effects of poor Web site performance your competitive analysis? And how do you know how your site is fairing against the other firms you are competing against on a daily basis?

Competitive analysis has been a key component of the Web performance measurement field since it appeared in the mid-1990s. Firms want to understand how they are doing against other firms in the same competitive space. They need to know if their Web site is at a quantitative advantage or disadvantage with these other firms.

Web sites are almost always different in their presentation and design, but they all serve the same purpose: To convert visitors to buyers. Measuring this process in a structured way allows companies to cut through the differences that exist in design and presentation and cut directly to heart of the matter: Show me the money.
Competitive measurements allow you to determine where your firm is strong, where it is weak, and how it should prioritize its efforts to make it a better site that more effectively serves the needs of the customers, and the needs of the business.

Comparative Analysis

Most astute readers will be wondering how comparative analysis differs from competitive analysis. The differences are, in fact, fundamental to the way they are used. Where competitive analysis provides insight into the unique business challenges faced by a group of firms serving the needs of similar customers, comparative analysis forces your organization to look at performance more broadly.

Your customers and visitors do not just visit your site. I know this may come as a surprise, but it’s true. As a result, they carry with them very clear ideas of how fast a fast site is. And while your organization may have overcome many challenges to become the performance leader in your sector, you can only say that you understand the true meaning of performance once you have stepped outside your comfort zone and compared yourself to the true leaders in performance online.

On a daily basis, your customers compare your search functionality to firms who do nothing but provide search results to millions of people each day. They compare how long it takes to autheticate and get a personalized landing page on your site to the experiences they have at their bank, their favourite retailers. The compare the speed with which specific product pages load.

They may not do this consciously. But these consumers carry with them an expectation of performance, and they know when your site is or is not delivering it.
So, how do you define fast? Fast is what you make it. As a firm with a Web site that is serving the needs of customers or visitors, you have to be ready to accept that there are others out there who have solved many of the problems you may be facing. Broaden your perspective and put your site in the harsh light of these three spotlights, and your organization will be on its way to evolving its Web performance perspective.

The Dichotomy of the Web: Andy King's Website Optimization

Andy King's Website Optimization, O'Reilly 2008The Web is a many-splendored thing, with a very split personality. One side is drive to find ways to make the most money possible, while the other is driven to implement cool technology in an effective and efficient manner (most of the time).

Andy King, in Website Optimization (O’Reilly), tries to address these two competing forces in a way that both can understand. This is important because, as we all know from our own lives, most of the time these two competing parts of the same whole are right; they just don’t understand the other side.

I have seen this trend repeated throughout my nine years in the Web performance industry, five years as a consultant. Companies torn asunder, viewing the Business v. Technology interaction as a Cold War, one that occasionally flares up in odd places which serve as proxies between the two.

Website Optimization appears at first glance to be torn asunder by this conflict. With half devoted to optimizing the site for business and the other to performance and design optimization, there will be a cry from the competing factions that half of this book is a useless waste of time.

These are the organizations and individuals who will always be fighting to succeed in this industry. These are the people and companies who don’t understand that success in both areas is critical to succeeding in a highly competitive Web world.
The first half of the book is dedicated to the optimization of a Web site, any Web site, to serve a well-defined business purpose. Discussing terms such as SEO, PPC, and CRO can curdle the blood of any hardcore techie, but they are what drive the design and business purpose of a Web site. Without a way to get people to a site, and use the information on the site to do business or complete the tasks that they need to, there is no need to have a technological infrastructure to support it.

Conversely, a business with lofty goals and a strategy that will change the marketplace will not get a chance to succeed if the site is slow, the pages are large, and design makes cat barf look good. Concepts such HTTP compression, file concatenation, caching, and JS/CSS placement drive this side of the personality, as well as a number of application and networking considerations that are just too far down the rat hole to even consider in a book with as broad a scope as this one.

Although on the surface, the concepts discussed in this book will see many people put it down as it isn’t business or techie enough, those who do buy the book will show that they have a grasp of the wider perspective, the one that drives all successful sites to stand tall in a sea of similarity.

See the Website Optimization book companion site for more information, chapter summaries and two sample chapters.

Web Performance, Part VII: Reliability and Consistency

In this series, the focus has been on the basic Web performance concepts, the ones that have dominated the performance management field for the last decade. It’s now time to step beyond these measures, and examine two equally important concepts, ones that allow a company to analyze their Web performance outside the constraints of performance and availability.

Reliability is often confused with availability when it is used in a Web performance context. Reliability, as a measurement and analysis concept goes far beyond the binary 0 or 1 that the term availability limits us to, and places it in the context of how availability affects the whole business.
Typical measures used in reliability include:

  • Minutes of outage
  • Number of failed measurements
  • Core business hours

Reliability is, by its very nature, a more complex way to examine the successful delivery of content to customers. It forces the business side of a company to define what times of day and days of the week affect the bottom-line more, and forces the technology side of the business to be able to account not simply for server uptime, but also for exact measures of when and why customers could not reach the site.
This approach almost always leads to the creation of a whole new metric, one that is uniquely tied to the expectations and demands of the business it was developed in. It may also force organizations to focus on key components of their online business, if a trend of repeated outages appears with only a few components of the Web site.

Consistency is uniquely paired with Reliability, in that it extends the concept of performance to beyond simple aggregates, and considers what the performance experience is like for the customer on each visit. Can a customer say that the site always responds the same way, or do you hear that sometimes your site is slow and unusable? Why is the performance of your site inconsistent?

A simple way to think of consistency is the old standby of the Standard Deviation. This gives the range in which the population of the measurements is clustered around the Arithmetic Mean. This value can depend on the number of measures in the population, as well as the properties of these unique measures.

Standard Deviation has a number of flaws, but provides a simple way to define consistency: a large standard deviation value indicates a high degree of inconsistency within the measurement population, whereas a low small standard deviation value indicates a higher degree of consistency.

The metric that is produced for consistency differs from the reliability metric in that it will always be measured in seconds or milliseconds. But the same insight may arise from consistency, that certain components of the Web site contribute more to the inconsistency of a Web transaction. Isolating these elements outside the context of the entire business process gives organizations the information they need to eliminate these issues more quickly.

Companies that have found that simple performance and availability metrics constrain their ability to accurately describe the performance of their Web site need to examine ways to integrate a formula for calculating Reliability, and a measure of Consistency into their performance management regime.

Web Performance, Part VI: Benchmarking Your Site

In the last article in this series, the concept of baselining your measurements was discussed. This is vital, in order for you and your organization to be able to identify the particular performance patterns associated with your site.

Now that’s under control, you’re done, right?

Not a chance. Remember that your site is not the only Web site your customers visit. So, how are you doing against all of those other sites?

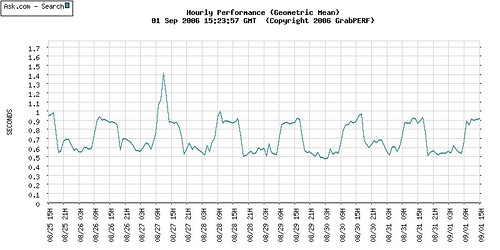
Let’s take a simple example of the performance for one week for one of the search firms. This is simply an example; I am just too lazy to change the names to protect the innocent.

one_search-7day

Doesn’t look too bad. An easily understood pattern of slower performance during peak business hours appears in the data, presenting a predictable pattern which would serve as a great baseline for any firm. However, this baseline lacks context. If anyone tries to use a graph like this, the next question you should ask is “So what?”.

What makes a graph like this interesting but useless? That’s easy: A baseline graph is only the first step in the information process. A graph of your performance tells you how your site is doing. There is, however, no indication of whether this performance trend is good or bad.

four_search-7day

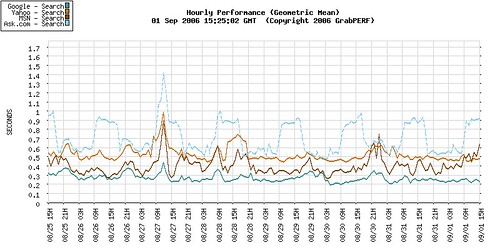
Examining the performance of the same firm within a competitive and comparative context, the predictable baseline performance still appears predictable, but not as good as it could be. The graph shows that most of the other firms in the same vertical, performing the identical search, over the same period of time, and from the same measurement locations, do not show the same daytime pattern of performance degradation.

The context provided by benchmarking now becomes a critical factor. By putting the site side-by-side with other sites delivering the same service, an organization can now question the traditional belief that the site is doing well because we can predict how it will behave.

A simple benchmark such as the one above forces a company to ask hard questions, and should lead to reflection and re-examination of what the predictable baseline really means. A benchmark result should always lead a company to ask if their performance is good enough, and if they want to get better, what will it take.
Benchmarking relies on the idea of a business process. The old approach to benchmarks only considered firms in the narrowly defined scope of the industry verticals; another approach considers company homepages without any context or reliable comparative structure in place to compensate for the differences between pages and sites.

It is not difficult to define a benchmark that allows for the comparison of a major bank to a major retailer, and a major social networking site, and a major online mail provider. By clearly defining a business process that these sites share (in this case let’s take the user-authentication process) you can compare companies across industry verticals.

This cross-discipline comparison is crucial. Your customers do this with your site every single day. They visit your site, and tens, maybe hundreds, of other sites every week. They don’t limit their comparison to sites in the same industry vertical; they perform cross-vertical business process critiques intuitively, and then share these results with others anecdotally.

In many cases, a cross-vertical performance comparison cannot be performed, as there are too many variables and differences to perform a head-to-head speed analysis. Luckily for the Web performance field, speed is only one metric that can be used for comparison. By stretching Web site performance analysis beyond speed, comparing sites with vastly different business processes and industries can be done in a way that treats all sites equally. The decade-long focus on speed and performance has allowed other metrics to be pushed aside.

Having a fast site is good. But that’s not all there is to Web performance. If you were to compare the state of Web performance benchmarking to the car-buying public, the industry has been stuck in the role of a power-hungry, horsepower-obsessed teenage boy for too long. Just as your automobile needs and requirements evolve (ok, maybe this doesn’t apply to everyone), so do your Web performance requirements.

Web Performance, Part V: Baseline Your Data

Up to this point, the series has focused on the mundane world of calculating statistical values in order to represent your Web performance data in some meaningful way. Now we step into the more exciting (I lead a sheltered life) world of analyzing the data to make some sense from it.

When companies sign up with a Web performance company, it has been my experience that the first thing that they want to do is get in there and push all the buttons and bounce on the seats. This usually involves setting up a million different measurements, and then establishing alerting thresholds for every single one of them that is of critical importance, emailed to the pagers of the entire IT team all the time.

Well interesting, it is also a great way for people to begin to actually ignore the data because:

  1. It’s not telling them what they need to know
  2. It’s telling them stuff when they don’t need to know it.

When I speak to a company for the first time, I often ask what their key online business processes are. I usually get either stunned silence or “I don’t know” as a response. Seriously, what has been purchased is a tool, some new gadget that will supposedly make life better; but no thought has been put into how to deploy and make use of the data coming in.

I have the luxury of being able to concentrate on one set of data all the time. In most environments, the flow of data from systems, network devices, e-mail updates, patches, business data simply becomes noise to be ignored until someone starts complaining that something is wrong. Web performance data becomes another data flow to react to, not act on.

So how do you begin to corral the beast of Web performance data? Start with the simplest question: what do we NEED to measure?

If you talked to IT, Marketing and Business Management, they will likely come up with three key areas that need to be measured:

  1. Search
  2. Authentication
  3. Shopping Cart

Technology folks say, but that doesn’t cover the true complexity of our relational, P2P, AJAX-powered, social media, tagging Web 2.0 site.

Who cares! The three items listed above pay the bills and keep the lights on. If one of these isn’t working, you fix it now, or you go home.

Now, we have three primary targets. We’re set to start setting up alerts, and stuff, right?

Nope. You don’t have enough information yet.

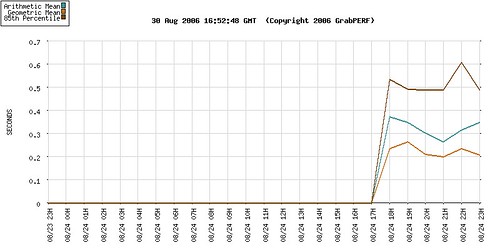
1stday

This is your measurement after the first day. This gives you enough information to do all those bright and shiny things that you’ve heard your new Web performance tool can do, doesn’t it?

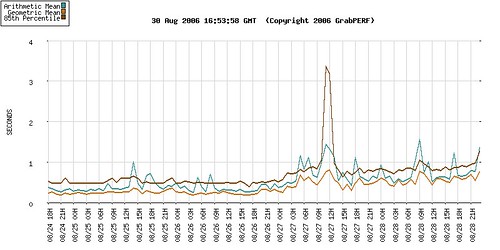
4day

Here’s the same measurement after 4 days. Subtle but important changes have occurred. The most important of these is that the first day that data was gathered happened to be on a Friday night. Most sites would agree that the performance on a Friday night is far different than what you would find on a Monday morning. Monday morning shows this site showing a noticeable performance shift upward.

And what do you do when your performance looks like this?

long-term

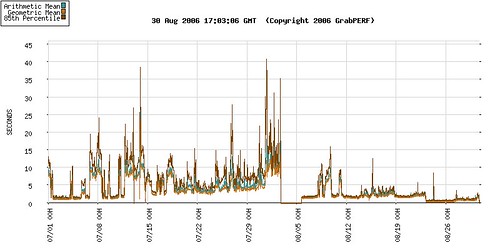
Baselining is the ability to predict the performance of your site under normal circumstances on an ongoing basis. This is based on the knowledge that comes from understanding how the site has performed in the past, as well as how it has behaved under situations of abnormal behavior. Until you can predict how your site should behave, you can begin to understand why it behaves the way it does.

Focusing on the three key transaction paths or business processes listed above helps you and your team wrap your head around what the site is doing right now. Once a baseline for the site’s performance exists, then you can begin to benchmark the performance of your site by comparing it to others doing the same business process.

Web Performance, Part IV: Finding The Frequency

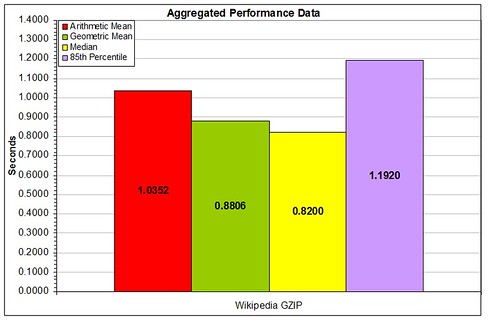
In the last article, I discussed the aggregated statistics used most frequently to describe a population of performance data.
stats-articles
The pros and cons of each of these aggregated values has been examined, but now we come to the largest single flaw: these values attempt to assign a single value to describe an entire population of numbers.

The only way to describe a population of numbers is to do one of two things: Display every single datapoint in the population against the time it occurred, producing a scatter plot; or display the population as a statistical distribution.

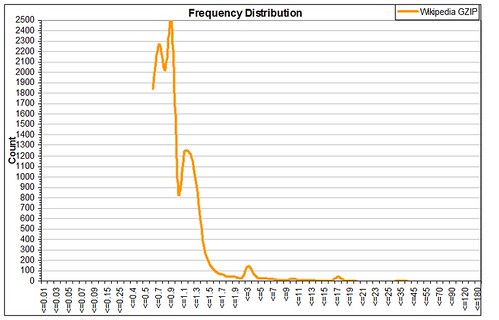
The most common type of statistical distribution used in Web performance data is the Frequency Distribution. This type of display breaks the population down into measurements of a certain value range, then graphs the results by comparing the number of results in each value container.

So, taking the same population data used in the aggregated data above, the frequency distribution looks like this.
stats-articles-frequency
This gives a deeper insight into the whole population, by displaying the whole range of measurements, including the heavy tail that occurs in many Web performance result sets. Please note that a statistical heavy tail is essentially the same as Chris Anderson’s long tail, but in statistical analysis, a heavy tail represents a non-normally distributed data set, and skews the aggregated values you try and produce from the population.

As was noted in the aggregated values, the ‘average’ performance like falls between 0.88 and 1.04 seconds. Now, when you take these values and compare them to the frequency distribution, these values make sense, as the largest concentration of measurement values falls into this range.

However, the 85th Percentile for this population is at 1.20 seconds, where there is a large secondary bulge in the frequency distribution. After that, there are measurements that trickle out into the 40-second range.

As can be seen, a single aggregated number cannot represent all of the characteristics in a population of measurements. They are good representations, but that’s all they are.

So, to wrap up this flurry of a visit through the world of statistical analysis and Web performance data, always remember the old adage: Lies, Damn Lies, and Statistics.
In the next article, I will discuss the concept of performance baselining, and how this is the basis for Web performance evolution.

Copyright © 2024 Performance Zen

Theme by Anders NorenUp ↑