Tag: Business of web performance

Web Performance, Part III: Moving Beyond Average

In the previous article in this series, I talked about the fallacy of ‘average’ performance. Now that this has been dismissed, what do I propose to replace it with. There are three aggregated values that can be used to better represent Web performance data:

The links take you to articles that better explain the math behind each of these statistics. The focus here is why you would choose to use them rather than Arithmetic Mean.

The Median is the central point in any population of data. It is equal to the calculated value of the 50th Percentile, and is the point where half of the population lies above and below. So, in a large population of data, it can provide a good estimation of where center or average performance value is, regardless of the outliers at either end of the scale.

Geometric Mean is, well, a nasty calculation that I prefer to allow programmatic functions to handle for me. The advantage that it has over the Arithmetic Mean is that is influenced less by the outliers, producing a value that is always lower than or equal to the Arithmetic Mean. In the case of Web performance data, with populations of any size, the Geometric Mean is always lower than the Arithmetic Mean.

The 85th Percentile is the level below which 85% of the population of data lies. Now, some people use the 90th or the 95th, but I tend to cut Web sites more slack by granting them a pass on 15% of the measurement population.
So, what do these values look like?

stats-articles

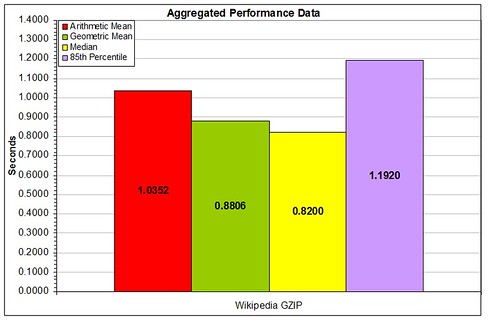
These aggregated performance values are extracted from the same data population. Immediately, some things become clear. The Arithmetic Mean is higher than the Median and the Geometric Mean, by more than 0.1 seconds. The 85th Percentile is 1.19 seconds and indicates that 85% of all measurements in this data set are below this value.

Things that are bad to see:

  • An Arithmetic Mean that is substantially higher than the Geometric Mean and the Median
  • An 85th Percentile that is more than double the Geometric Mean

In these two cases, it indicates that there is a high number of large values in the measurement population, and that the site is exhibiting consistency issues, a topic for a later article in this series.

In all, these three metric provide a good quick hit, a representative single number that you can present in a meeting to say how the site is performing. But they all suffer from the same flaw — you cannot represent the entire population with an entire number.

The next article will discuss Frequency Distributions, and their value in the Web performance analysis field.

Web Performance, Part II: What are you calling average?

For a decade, the holy grail of Web performance has been a low average performance time. Every company wants to have the lowest time, in some kind of chest-thumping, testosterone-pumped battle for supremacy.

Well, I am here to tell you that the numbers you have been using for the last decade have been lying. Well, lying is perhaps to strong a term. Deeply misleading is perhaps the more accurate way to describe the way that an average describes a population of results.
Now before you call your Web performance monitoring and measurement firms and tear a strip off them, let’s look at the facts. The numbers that everyone has been holding up as the gospel truth have been averages, or, more correctly, Arithmetic Means. We all learned these in elementary school: the sum of X values divided by X produces a value that approximates the average value for the entire population of X values.

Where could this go wrong in Web performance?

We wandered off course in a couple of fundamental ways. The first is based on the basic assumption of Arithmetic Mean calculations, that the population of data used is more or less Normally Distributed.

Well folks, Web performance data is not normally distributed. Some people are more stringent than I am, but my running assumption is that in a population of measurements, up to 15% are noise resulting from “stuff happens on the Internet”. This outer edge of noise, or outliers, can have a profound skewing effect on the Arithmetic Mean for that population.

“So what?”, most of you are saying. Here’s the kicker: As a result of this skew, the Arithmetic Mean usually produces a Web performance number that is higher than the real average of performance.

So why do we use it? Simple: Relational databases are really good at producing Arithmetic Means, and lousy at producing other statistical values. Short of writing your own complex function, which on most database systems equates to higher compute times, the only way to produce more accurate statistical measures is to extract the entire population of results and produce the result in external software.
If you are building an enterprise class Web performance measurement reporting interface, and you want to calculate other statistical measures, you better have deep pockets and a lot of spare computing cycles, because these multi-million row calculations will drain resources very quickly.

So, for most people, the Arithmetic Mean is the be all and end all of Web performance metrics. In the next part of this series, I will discuss how you can break free of this madness and produce values that are truer representations of average performance.

Web Performance, Part I: Fundamentals

If you ask 15 different people what the phrase Web performance means to them, you will get 30 different answers. Like all things in this technological age, the definition is in the eye of the beholder. To the Marketing person, it is delivering content to the correct audience in a manner that converts visitors into customers. To the business leader, it is the ability of a Web site to deliver on a certain revenue goal, while managing costs and creating shareholder/investor value.

For IT audiences, the mere mention of the phrase will spark a debate that would frighten the UN Security Council. Is it the Network? The Web server? The designers? The application? What is making the Web site slow?

So, what is Web performance? It is everything mentioned above, and more. Working in this industry for nine years, I have heard all facets of the debate. And all of the above positions will appear in every organization with a Web site to varying degrees.

In this ongoing series, I will examine various facets of Web performance, from the statistical measures used to truly analyze Web performance data, to the concepts that drive the evolution of a company from “Hey, we really need to know how fast our Web page loads” to “We need to accurately correlate the performance of our site to traffic volumes and revenue generation”.

Defining Web performance is much harder than it seems. It’s simplest metrics are tied into the basic concepts of speed and success rate (availability). These concepts have been around a very long time, and are understood all the way up to the highest levels of any organization.

However, this very simple state is one that very few companies manage to evolve away from. It is the lowest common denominator in Web performance, and only provides a mere scraping of the data that is available within every company.
As a company evolves and matures in its view toward Web performance, the focus shifts away from the basic data, and begins to focus on the more abstract concepts of reliability and consistency. These force organizations to step away from the aggregated and simplistic approach of speed and availability, to a place where the user experience component of performance is factored into the equation.

After tackling consistency and reliability, the final step is toward performance optimization. This is a holistic approach to Web performance, a place where speed and availability data are only one component of an integrated whole. Companies at this strata are usually generating their own performance dashboards with combinations of data sources that correlate disparate data sources in a way that provides a clear and concise view not only of the performance of their Web site, but also of the health of their entire online business.

During this series, I will refer to data and information very frequently. In today’s world, even after nearly a decade of using Web performance tools and services, most firms only rely on data. All that matters is that the measurements arrive.
The smartest companies move to the next level and take that data and turn it into information, ideas that can shape the way that they design their Web site, service their customers, and view themselves against the entire population of Internet businesses.

This series will not be a technical HOWTO on making your site faster. I cover a lot of that ground in another of my Web sites.

What this series will do is lead you through the minefield of Web performance ideas, so that when you are asked what you think Web performance is, you can present the person asking the question with a clear, concise answer.
The next article in this series will focus on Web performance measures: why and when you use them, and how to present them to a non-technical audience.

GrabPERF: Search Index Weekly Results (Aug 29-Sep 4, 2005)

The weekly GrabPERF Search Index Results are in. Sorry for the delay.
Week of August 29, 2005 – September 4, 2005

TEST                     RESULT  SUCCESS  ATTEMPTS
--------------------  ---------  -------  --------
PubSub - Search       0.4132426    99.95      5561
Google - Search       0.5546451   100.00      5570
MSN - Search          0.7807107    99.87      5572
Yahoo - Search        0.7996602    99.98      5571
eBay - Search         0.9371296   100.00      5571
Feedster - Search     1.1738754    99.96      5569
Newsgator - Search    1.2168921    99.96      5569
BlogLines - Search    1.2857559    99.71      5571
BestBuy.com - Search  1.4136253    99.98      5572
Blogdigger - Search   1.8896126    99.74      5462
BENCHMARK RESULTS     1.9096960    99.79     75419
Amazon - Search       1.9795655    99.84      3123
Technorati - Search   2.7727073    99.60      5566
IceRocket - Search    5.0256308    99.43      5571
Blogpulse - Search    6.5206247    98.98      5571

These results are based on data gathered from three remote measurement locations in North America. Each location takes a measurement approximately once every five minutes.

The measurements are for the base HTML document only. No images or referenced files are included.

Musing on Correlation Systems

In the world of Web performance, the agreed upon state of Nirvana is the development of an automated system that will isolate, identify, diagnose and resolve (or suggest a resolution) to an issue.  However, the question for me is whether these systems are really useful.

Why do I say that? Because they solve the tactical issues. The day-to-day issues. But there is no solution for poor design, inadequate eqipment, overloaded systems, and other strategic decisions. Automated performance systems do not solve the underlying problem — delivering reliable and relevant information on Web performance metrics that matter to business customers.

Who consumes Web performance data? Technology teams.

Who needs holistic Web performance information? Business leaders.

Who does the Web performance industry currently serve?

Thoughts on Web Performance Excellence

In writing the last post, I was thinking about what factors go into making the Web performance of a site “excellent”. What defines in the minds of the sites users/customers/visitors/critics/competitors that the performance of a Web site is excellent?

These are usually judged by the standard factors:

  • Responsiveness
  • Availability
  • Traffic
  • Reliability
  • Security
  • Clarity

But within the company itself, how is the performance of their Web site judged to be excellent?

Right now, most people use the external metrics mentioned above to determine excellence. However, it must be remembered that there are two other critical factors that need to be considered when managing a large IT infrastructure.

  • Ease of Management. This is a metric that is often overlooked when determining if a Web site is excellent from an internal perspective. Often it is simply assumed that running a large IT infrastructure is incredibly complex; in most cases this is true. However, is it too complex too manage efficiently and effectively? How much time is spent finding the cause of problems as compared to resolving them?
  • Cost of Operation. This is always a big one with me. I look at sites that are trying to squeeze as much performance and availability out of their sites as they can. At some point, the business has to step back and ask, “How much does another half-second of speed cost us?”. When this context is placed around the “need for speed”, it may open a few eyes.

When this two critical internal factors are combined with the raw external data that can be collected, collated and analyzed, some other ideas come to the forefront as KPIs in Web Performance Excellence:

  • Cost Per Second. The cost of a Web site is usually only calculated based on the negative metric of how much it costs when the site is down. Well, how much does it cost when the site is up? Can that number be reduced?
  • Revenue By Speed. Which customers spend the most on your site: LAN, home-broadband, or dial-up?
  • Person-hours per day. How many person-hours per day does it take to manage your Web site?
  • True Cost of Performance Issues. When there is a performance issue, the cost is usually associated with lost revenue. Reverse that and ask how much did it cost in time and materials to resolve the issue.

The creation of new Web performance excellence metrics is crucial if companies truly want to succeed in the e-business arena. Business management has to demand that IT management become more accountable to the entire business, using metrics that clearly display the true cost of doing business on the Web.

Service Level Agreements in Web Performance

Service Level Agreements (SLAs) appear to finally be maturing in the realm of Web performance. Both of the Web performance companies that I have worked for have understood their importance, but convincing the market of the importance of these metrics has been a challenge up until recently.

In the bandwidth and networking industries, SLAs have been a key component of contracts for many years. However, as Doug Kaye outlined in his book Strategies for Web Hosting and Managed Services, SLAs can also be useless.

The key to determining a useful Web performance SLA rests on some clear business concepts: relevance and enforceability. Many papers have been written on how to calculate SLAs, but that leaves companies still staggering with the understanding that they need SLAs, but don’t understand them.

Relevance

Relevance is a key SLA metric because an SLA defined by someone else may have no meaning to the types of metrics your business measures itself on. Whether the SLA is based on performance, availability or a weighted virtual metric designed specifically by the parties bound by the agreement, it has to mean something, and be meaningful.

The classic SLA is average performance of X seconds and availability of Y% over period Z. This is not particularly useful to businesses, as they have defines business metrics that they already use.

Take for example a stock trading company. in most cases, they are curious, but not concerned with their Web performance and availability between 17:00 and 08:00 Eastern Time. But when the markets are open, these metrics are critical to the business.

Now, try and take your stock-trading metric and overlay it at Amazon or eBay. Doesn’t fit. So, in a classic consultative fashion, SLAs have to be developed by asking what is useful to the client.

  • Who is to be involved in the SLA process?
  • How do SLAs for Internal Groups differ from those for External vendors?
  • Will this be pure technical measurement? Will business data be factored in?

Asking and answering these questions makes the SLA definition process relevant to the Web performance objectives set by the organization.

Enforceability

The idea that an SLA with no teeth could exist is almost funny. But if you examine the majority of SLAs that are contracted between businesses in the Web performance space today, you will find that they are so vaguely defined and meaningless to the business objectives that actually enforcing the penalty clauses is next to impossible.

As real world experience shows, it is extremely difficult for most companies enforce SLAs. If the relevance objectives discussed above are hammered out so that the targets are clear and precise, then enforcement becomes a snap. The relevance objective often fails, because the SLA is imposed by one party on another; or an SLA is included in a contract as a feature, but when something goes wrong, escape path is clear for the “violating” party.

If an organization would like to try and develop a process to define enforceable SLAs, start with the internal business units. These are easier to develop, as everyone has a shared business objective, and all disputes can be arbitrated by internal executives or team leaders.

Once the internal teams understand and are able to live with the metrics used to measure the SLAs, then this can be extended to vendors. The important part of this extension is that third-party SLA measurement organizations will need to become involved in this process.

Some would say that I am tooting my own horn by advocating the use of these third-party measurement organizations, as I have worked for two of the leaders in this area. The need for a neutral third-party is crucial in this scenario; it would be like watching a soccer match (football for the enlightened among you) without the mediating influence of the referee.


If your organization is now considering implementing SLAs, then it is crucial that these agreements are relevant and enforceable. That way, both parties understand and will strive to meet easily measured and agreed upon goals, and understand that there are penalties for not delivering performance excellence.

Copyright © 2024 Performance Zen

Theme by Anders NorenUp ↑