Tag: web performance management

Web Performance Concepts Series – Revisited

Two years ago I created a series of five blog articles, aimed at both business and technical readers, with the goal of explaining the basic statistical concepts and methods I use when analyzing Web performance data in my role as a Web performance consultant.

Most of these ideas were core to my thinking when I developed GrabPERF in 2005-2006, as I determined that it was vital that people not only receive Web performance measurement data for their site, but they receive it in a way that allows them to inform and shape the business and technical decisions they make on a daily basis.

While I come from a strong technical background, it is critical to be able to present the data that I work with in a manner that can be useful to all components of an organization, from the IT and technology leaders who shape the infrastructure and design of a site, to the marketing and business leaders who set out the goals for the organization and interact with customers, vendors and investors.

Providing data that helps negotiate the almost religious dichotomy that divides most organizations is crucial to providing a comprehensive Web performance solution to any organization.

These articles form the core of an ongoing series of discussion focused on the the pitfalls of Web performance analysis, and how to learn and avoid the errors others have already discovered.

The series went over like a lead balloon and this left me puzzled. While the basic information in the articles was technical and focused on the role that simple statistics play in affecting Web performance technology and business decisions inside an organization, they formed the core of what I saw as an ongoing discussion that organizations need to have to ensure that an organization moves in a single direction, with a single purpose.

I have decided reintroduce this series, dredging it from the forgotten archives of this blog, to remind business and IT teams of the importance of the Web performance data they use every day. It also serves as a guide to interpreting the numbers that arise from all the measurement methodologies that companies use, a map to extract the most critical information in the raging sea of data.

The five articles are:

  1. Web Performance, Part I: Fundamentals
  2. Web Performance, Part II: What are you calling average?
  3. Web Performance, Part III: Moving Beyond Average
  4. Web Performance, Part IV: Finding The Frequency
  5. Web Performance, Part V: Baseline Your Data

I look forward to your comments and questions on these topics.

Web Performance, Part VII: Reliability and Consistency

In this series, the focus has been on the basic Web performance concepts, the ones that have dominated the performance management field for the last decade. It’s now time to step beyond these measures, and examine two equally important concepts, ones that allow a company to analyze their Web performance outside the constraints of performance and availability.

Reliability is often confused with availability when it is used in a Web performance context. Reliability, as a measurement and analysis concept goes far beyond the binary 0 or 1 that the term availability limits us to, and places it in the context of how availability affects the whole business.
Typical measures used in reliability include:

  • Minutes of outage
  • Number of failed measurements
  • Core business hours

Reliability is, by its very nature, a more complex way to examine the successful delivery of content to customers. It forces the business side of a company to define what times of day and days of the week affect the bottom-line more, and forces the technology side of the business to be able to account not simply for server uptime, but also for exact measures of when and why customers could not reach the site.
This approach almost always leads to the creation of a whole new metric, one that is uniquely tied to the expectations and demands of the business it was developed in. It may also force organizations to focus on key components of their online business, if a trend of repeated outages appears with only a few components of the Web site.

Consistency is uniquely paired with Reliability, in that it extends the concept of performance to beyond simple aggregates, and considers what the performance experience is like for the customer on each visit. Can a customer say that the site always responds the same way, or do you hear that sometimes your site is slow and unusable? Why is the performance of your site inconsistent?

A simple way to think of consistency is the old standby of the Standard Deviation. This gives the range in which the population of the measurements is clustered around the Arithmetic Mean. This value can depend on the number of measures in the population, as well as the properties of these unique measures.

Standard Deviation has a number of flaws, but provides a simple way to define consistency: a large standard deviation value indicates a high degree of inconsistency within the measurement population, whereas a low small standard deviation value indicates a higher degree of consistency.

The metric that is produced for consistency differs from the reliability metric in that it will always be measured in seconds or milliseconds. But the same insight may arise from consistency, that certain components of the Web site contribute more to the inconsistency of a Web transaction. Isolating these elements outside the context of the entire business process gives organizations the information they need to eliminate these issues more quickly.

Companies that have found that simple performance and availability metrics constrain their ability to accurately describe the performance of their Web site need to examine ways to integrate a formula for calculating Reliability, and a measure of Consistency into their performance management regime.

Web Performance, Part VI: Benchmarking Your Site

In the last article in this series, the concept of baselining your measurements was discussed. This is vital, in order for you and your organization to be able to identify the particular performance patterns associated with your site.

Now that’s under control, you’re done, right?

Not a chance. Remember that your site is not the only Web site your customers visit. So, how are you doing against all of those other sites?

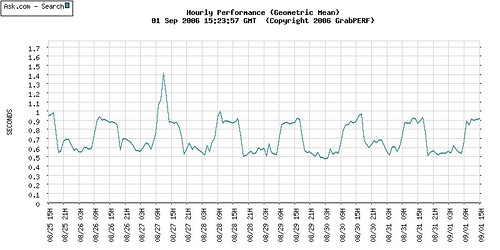
Let’s take a simple example of the performance for one week for one of the search firms. This is simply an example; I am just too lazy to change the names to protect the innocent.

one_search-7day

Doesn’t look too bad. An easily understood pattern of slower performance during peak business hours appears in the data, presenting a predictable pattern which would serve as a great baseline for any firm. However, this baseline lacks context. If anyone tries to use a graph like this, the next question you should ask is “So what?”.

What makes a graph like this interesting but useless? That’s easy: A baseline graph is only the first step in the information process. A graph of your performance tells you how your site is doing. There is, however, no indication of whether this performance trend is good or bad.

four_search-7day

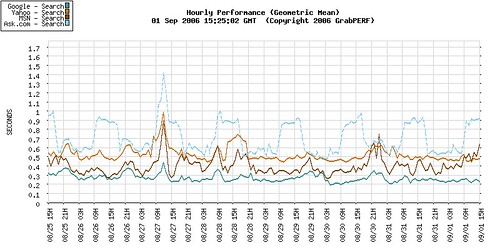
Examining the performance of the same firm within a competitive and comparative context, the predictable baseline performance still appears predictable, but not as good as it could be. The graph shows that most of the other firms in the same vertical, performing the identical search, over the same period of time, and from the same measurement locations, do not show the same daytime pattern of performance degradation.

The context provided by benchmarking now becomes a critical factor. By putting the site side-by-side with other sites delivering the same service, an organization can now question the traditional belief that the site is doing well because we can predict how it will behave.

A simple benchmark such as the one above forces a company to ask hard questions, and should lead to reflection and re-examination of what the predictable baseline really means. A benchmark result should always lead a company to ask if their performance is good enough, and if they want to get better, what will it take.
Benchmarking relies on the idea of a business process. The old approach to benchmarks only considered firms in the narrowly defined scope of the industry verticals; another approach considers company homepages without any context or reliable comparative structure in place to compensate for the differences between pages and sites.

It is not difficult to define a benchmark that allows for the comparison of a major bank to a major retailer, and a major social networking site, and a major online mail provider. By clearly defining a business process that these sites share (in this case let’s take the user-authentication process) you can compare companies across industry verticals.

This cross-discipline comparison is crucial. Your customers do this with your site every single day. They visit your site, and tens, maybe hundreds, of other sites every week. They don’t limit their comparison to sites in the same industry vertical; they perform cross-vertical business process critiques intuitively, and then share these results with others anecdotally.

In many cases, a cross-vertical performance comparison cannot be performed, as there are too many variables and differences to perform a head-to-head speed analysis. Luckily for the Web performance field, speed is only one metric that can be used for comparison. By stretching Web site performance analysis beyond speed, comparing sites with vastly different business processes and industries can be done in a way that treats all sites equally. The decade-long focus on speed and performance has allowed other metrics to be pushed aside.

Having a fast site is good. But that’s not all there is to Web performance. If you were to compare the state of Web performance benchmarking to the car-buying public, the industry has been stuck in the role of a power-hungry, horsepower-obsessed teenage boy for too long. Just as your automobile needs and requirements evolve (ok, maybe this doesn’t apply to everyone), so do your Web performance requirements.

GrabPERF: Search Index Weekly Results (Aug 29-Sep 4, 2005)

The weekly GrabPERF Search Index Results are in. Sorry for the delay.
Week of August 29, 2005 – September 4, 2005

TEST                     RESULT  SUCCESS  ATTEMPTS
--------------------  ---------  -------  --------
PubSub - Search       0.4132426    99.95      5561
Google - Search       0.5546451   100.00      5570
MSN - Search          0.7807107    99.87      5572
Yahoo - Search        0.7996602    99.98      5571
eBay - Search         0.9371296   100.00      5571
Feedster - Search     1.1738754    99.96      5569
Newsgator - Search    1.2168921    99.96      5569
BlogLines - Search    1.2857559    99.71      5571
BestBuy.com - Search  1.4136253    99.98      5572
Blogdigger - Search   1.8896126    99.74      5462
BENCHMARK RESULTS     1.9096960    99.79     75419
Amazon - Search       1.9795655    99.84      3123
Technorati - Search   2.7727073    99.60      5566
IceRocket - Search    5.0256308    99.43      5571
Blogpulse - Search    6.5206247    98.98      5571

These results are based on data gathered from three remote measurement locations in North America. Each location takes a measurement approximately once every five minutes.

The measurements are for the base HTML document only. No images or referenced files are included.

Musing on Correlation Systems

In the world of Web performance, the agreed upon state of Nirvana is the development of an automated system that will isolate, identify, diagnose and resolve (or suggest a resolution) to an issue.  However, the question for me is whether these systems are really useful.

Why do I say that? Because they solve the tactical issues. The day-to-day issues. But there is no solution for poor design, inadequate eqipment, overloaded systems, and other strategic decisions. Automated performance systems do not solve the underlying problem — delivering reliable and relevant information on Web performance metrics that matter to business customers.

Who consumes Web performance data? Technology teams.

Who needs holistic Web performance information? Business leaders.

Who does the Web performance industry currently serve?

Thoughts on Web Performance Excellence

In writing the last post, I was thinking about what factors go into making the Web performance of a site “excellent”. What defines in the minds of the sites users/customers/visitors/critics/competitors that the performance of a Web site is excellent?

These are usually judged by the standard factors:

  • Responsiveness
  • Availability
  • Traffic
  • Reliability
  • Security
  • Clarity

But within the company itself, how is the performance of their Web site judged to be excellent?

Right now, most people use the external metrics mentioned above to determine excellence. However, it must be remembered that there are two other critical factors that need to be considered when managing a large IT infrastructure.

  • Ease of Management. This is a metric that is often overlooked when determining if a Web site is excellent from an internal perspective. Often it is simply assumed that running a large IT infrastructure is incredibly complex; in most cases this is true. However, is it too complex too manage efficiently and effectively? How much time is spent finding the cause of problems as compared to resolving them?
  • Cost of Operation. This is always a big one with me. I look at sites that are trying to squeeze as much performance and availability out of their sites as they can. At some point, the business has to step back and ask, “How much does another half-second of speed cost us?”. When this context is placed around the “need for speed”, it may open a few eyes.

When this two critical internal factors are combined with the raw external data that can be collected, collated and analyzed, some other ideas come to the forefront as KPIs in Web Performance Excellence:

  • Cost Per Second. The cost of a Web site is usually only calculated based on the negative metric of how much it costs when the site is down. Well, how much does it cost when the site is up? Can that number be reduced?
  • Revenue By Speed. Which customers spend the most on your site: LAN, home-broadband, or dial-up?
  • Person-hours per day. How many person-hours per day does it take to manage your Web site?
  • True Cost of Performance Issues. When there is a performance issue, the cost is usually associated with lost revenue. Reverse that and ask how much did it cost in time and materials to resolve the issue.

The creation of new Web performance excellence metrics is crucial if companies truly want to succeed in the e-business arena. Business management has to demand that IT management become more accountable to the entire business, using metrics that clearly display the true cost of doing business on the Web.

Copyright © 2024 Performance Zen

Theme by Anders NorenUp ↑