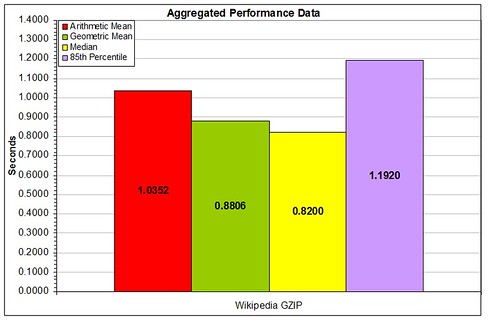
In the last article, I discussed the aggregated statistics used most frequently to describe a population of performance data.
The pros and cons of each of these aggregated values has been examined, but now we come to the largest single flaw: these values attempt to assign a single value to describe an entire population of numbers.
The only way to describe a population of numbers is to do one of two things: Display every single datapoint in the population against the time it occurred, producing a scatter plot; or display the population as a statistical distribution.
The most common type of statistical distribution used in Web performance data is the Frequency Distribution. This type of display breaks the population down into measurements of a certain value range, then graphs the results by comparing the number of results in each value container.
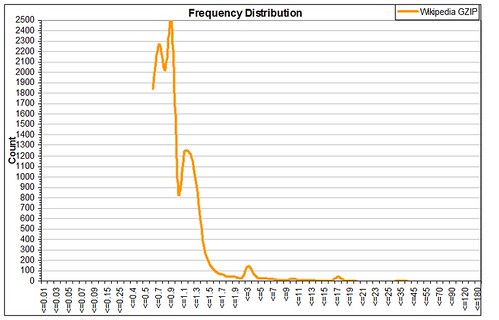
So, taking the same population data used in the aggregated data above, the frequency distribution looks like this.
This gives a deeper insight into the whole population, by displaying the whole range of measurements, including the heavy tail that occurs in many Web performance result sets. Please note that a statistical heavy tail is essentially the same as Chris Anderson’s long tail, but in statistical analysis, a heavy tail represents a non-normally distributed data set, and skews the aggregated values you try and produce from the population.
As was noted in the aggregated values, the ‘average’ performance like falls between 0.88 and 1.04 seconds. Now, when you take these values and compare them to the frequency distribution, these values make sense, as the largest concentration of measurement values falls into this range.
However, the 85th Percentile for this population is at 1.20 seconds, where there is a large secondary bulge in the frequency distribution. After that, there are measurements that trickle out into the 40-second range.
As can be seen, a single aggregated number cannot represent all of the characteristics in a population of measurements. They are good representations, but that’s all they are.
So, to wrap up this flurry of a visit through the world of statistical analysis and Web performance data, always remember the old adage: Lies, Damn Lies, and Statistics.
In the next article, I will discuss the concept of performance baselining, and how this is the basis for Web performance evolution.

Leave a Reply