Author: spierzchala

Web Performance, Part IX: Curse of the Single Metric

While this post is aimed at Web performance, the curse of the single metric affects our everyday lives in ways that we have become oblivious to.

When you listen to a business report, the stock market indices are an aggregated metric used to represent the performance of a set group of stocks.

When you read about economic indicators, these values are the aggregated representations of complex populations of data, collected from around the country, or the world.

Sport scores are the final tally of an event, but they may not always represent how well each team performed during the match.

The problem with single metrics lies in their simplicity. When a single metric is created, it usually attempts to factor in all of the possible and relevant data to produce an aggregated value that can represent a whole population of results.
These single metrics are then portrayed as a complete representation of this complex calculation. The presentation of this single metric is usually done in such a way that their compelling simplicity is accepted as the truth, rather than as a representation of a truth.

In the area of Web performance, organizations have fallen prey to this need for the compelling single metric. The need to represent a very complex process in terms that can be quickly absorbed and understand by as large a group of people as possible.

The single metrics most commonly found in the Web performance management field are performance (end-to-end response time of the tested business process) and availability (success rate of the tested business process). These numbers are then merged and transformed by data from a number of sources (external measurements, hit counts, conversions, internal server metrics, packet loss), and this information is bubbled up in an organization. By the time senior management and decision-makers receive the Web performance results, that are likely several steps removed from the raw measurement data.

An executive will tell you that information is a blessing, but only when it speeds, rather than hinders, the decision-making process. A Web performance consultant (such as myself) will tell that basing your decisions on a single metric that has been created out of a complex population of data is madness.

So, where does the middle-ground lie between the data wonks and the senior leaders? The rest of this post is dedicated to introducing a few of the metrics that will, in a small subset of metrics, give a senior leaders better information to work from when deciding what to do next.

A great place to start this process is to examine the percentile distribution of measurement results. Percentiles are known to anyone who has children. After a visit to the pediatrician, someone will likely state that “My son/daughter is in the XXth percentile of his/her age group for height/weight/tantrums/etc”. This means that XX% of the population of children that age, as recorded by pediatricians, report values at or below the same value for this same metric.

Percentiles are great for a population of results like Web performance measurement data. Using only a small set of values, anyone can quickly see how many visitors to a site could be experiencing poor performance.

If at the median (50th percentile), the measured business process is 3.0 seconds, this means that 50% of all of the measurements looked at are being completed in 3.0 seconds or less.

If the executive then looks up to the 90th percentile and sees that it’s at 16.0 seconds, it can be quickly determined that something very bad has happened to affect the response times collected for the 40% of the population between these two points. Immediately, everyone knows that for some reason, an unacceptable number of visitors are likely experiencing degraded and unpredictable performance when they visit the site.

A suggestion for enhancing averages with percentiles is to use the 90th percentile value as a trim ceiling for the average. Then side-by-side comparisons of the untrimmed and trimmed averages can be compared. For sites with a larger number of response time outliers, the average will decrease dramatically when it is trimmed, while sites with more consistent measurement results will find their average response time is similar with and without the trimmed data.

It is also critical to examine the application’s response times and success rates throughout defined business cycles. A single response time or success rate value eliminates

  • variations by time of day
  • variations by day of week
  • variations by month
  • variations caused by advertising and marketing

An average is just an average. If at peak buiness hours, response times are 5.0 seconds slower than the average, then the average is meaningless, as business is being lost to poor performance which has been lost in the focus on the single metric.

All of these items have also fallen prey to their own curse of the single metric. All of the items discussed above aggregate the response time of the business process into a single metric. The process of purchasing items online is broken down into discrete steps, and different parts of this process likely take longer than others. And one step beyond the discrete steps are the objects and data that appear to the customer during these steps.

It is critical to isolate the performance for each step of the process to find the bottlenecks to performance. Then the components in those steps that cause the greatest response time or success rate degradation must be identified and targeted for performance improvement initiatives. If there are one or two poorly performing steps in a business process, focusing performance improvement efforts on these is critical, otherwise precious resources are being wasted in trying to fix parts of the application that are working well.

In summary, a single metric provides a sense of false confidence, the sense that the application can be counted on to deliver response times and success rates that are nearly the same as those simple, single metrics.

The average provides a middle ground, a line that says that is the approximate mid-point of the measurement population. There are measurements above and below this average, and you have to plan around the peaks and valleys, not the open plains. It is critical never to fall victim to the attractive charms that come with the curse of the single metric.

GrabPERF: State of the System

This is actually a short post to write, as the state of the GrabPERF system is currently very healthy. There was an eight-hour outage in early August 2008, but that was a fiber connectivity issue, not a system issue.
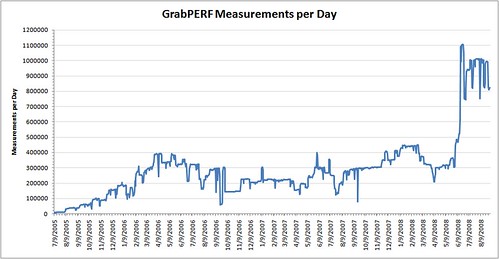
Over the history of ther service, we have been steadily increasing the number of measurements we take each day.

grabperf-measurements-per-day 

The large leap occurred when a very large number of tests were added to the system on a single day. But based on this data, the system is gathering more than 900,000 measurements every day.
Thanks to all of the people who volunteer their machines and bandwidths to support this effort!

Chrome v. Firefox – The Container and The Desktop

The last two days of using Chrome have had me thinking about the purpose of the Web browser in today’s world. I’ve talked about how Chrome and Firefox have changed how we see browsers, treating them as interactive windows into our daily life, rather than the uncontrolled end of an information firehose.
These applications, that on the surface seem to serve the same purpose, have taken very different paths to this point. Much has been made about Firefox growing out of the ashes of Netscape, while Chrome is the Web re-imagined.
It’s not just that.
Firefox, through the use of extensions and helper applications, has grown to become a Desktop replacement. Back when Windows for Workgroups was the primary end-user OS (and it wasn’t even an OS), Norton Desktop arrived to provide all of the tools that didn’t ship with the OS. It extended and improved on what was there, and made WFW a better place.
Firefox serves that purpose in the browser world. With its massive collections of extensions, it adds the ability to customize and modify the Web workspace. These extensions even allow the incoming content to be modified and reformatted in unique ways to suit the preferences of each individual. These features allowed the person using Firefox to feel in control, empowered.
You look at the Firefox installs of the tech elite, and no two installed versions will be configured in the same way. Firefox extends the browser into an aggregator of Web data and information customization.
But it does it at the Desktop.
Chrome is a simple container. There is (currently) no way to customize the look and feel, extend the capabilities, or modify the incoming or outgoing content. It is a simple shell designed to perform two key functions: search for content and interact with Web applications.
There are, of course, the hidden geeky functions that they have built into the app. But those don’t change what it’s core function is: request, receive, and render Web pages as quickly and efficiently as possible. Unlike Firefox’s approach, which places the app being the center of the Web, Chrome places the Web at the center of the Web.
There is no right or wrong approach. As with all things in this complicated world we are in, it depends. It depends on what you are trying to accomplish and how you want to get there.
The conflict that I see appearing over the next few months is not between IE and Firefox and Safari and Opera and Chrome. It is a conflict over what the people want from an application that they use all the time. Do they want a Web desktop or a Web container?

Chrome and Advertising – Google's Plan

Since I downloaded and started using Chrome yesterday, I have had to rediscover the world of online advertising. Using Firefox and Adblock Plus for nearly three years has shielded from their existence for the most part.
Stephen Noble, in a post on the Forrester Blog for Interactive Marketing Professionals, seems to discover that Chrome will be a source for injecting greater personalization and targeting into the online advertising market.
This is the key reason Chrome exists, right now.
While their may be discussions about the online platform and hosted applications, there are only a small percentage of Internet users who rely on hosted desktop-like applications, excluding email, in their daily work and life.
However, Google’s biggest money-making ventures are advertising and search. With control of AdSense and DoubleClick, there is no doubt that Google controls a vast majority of the targeted and contextual advertising market, around the world.
One of the greatest threats to this money-making is a lack of control of the platform through which ads are delivered. There is talk of IE8 blocking ads (well, non-Microsoft ads anyway), and one of the more popular extensions for Firefox is Adblock Plus. While Safari doesn’t have this ability natively built in, it can be supported by any number of applications that, in the name of Internet security, filter and block online advertisers using end-user proxies.
This threat to Google’s core revenue source was not ignored in the development of Chrome. One of the options is the use of DNS pre-fetching. Now I haven’t thrown up a packet sniffer, but what’s to prevent a part of the pre-fetching algorithm to go beyond DNS for certain content, and pre-fetch the whole object, so that the ads load really fast, and in that way are seen as less intrusive.
Ok, so I am noted for having a paraoid streak.
However, using the fastest rendering engine and a rocket-ship fast Javascript VM is not only good for the new generation of online Web applications, but plays right into the hands of improved ad-delivery.
So, while Chrome is being hailed as the first Web application environment, it is very much a context Web advertising environment as well.
It’s how it was built.

Hit Tracking with PHP and MySQL

Recently there was an outage at a hit-tracking vendor I was using to track the hits on my externally hosted blog, leaving me with a gap in my visitor data several hours long. While this was an inconvenience for me, I realized that this could be mission critical failure to an online business reliant on this data.
To resolve this, I used the PHP HTTP environment variables and the built-in function for converting IP addresses to IP numbers to create my own hit-tracker. It is a rudimentary tracking tool, but it provides me with the basic information I need to track visitors.
To begin, I wrote a simple PHP script to insert tracking data into a MySQL database. How do you do that? You use the gd features in PHP to draw an image, and insert the data into the database.


header ("Content-type: image/png");
include("dbconnect_logger.php");
$logtime = date("YmdHis");
$ipquery = sprintf("%u",ip2long($_SERVER['REMOTE_ADDR']));
        $query2 = "INSERT into logger.blog_log values \
               ($logtime,$ipquery,'$HTTP_USER_AGENT','$HTTP_REFERER')";
        mysql_query($query2) or die("Log Insert Failed");
mysql_close($link);
$im = @ImageCreate (1, 1)
or die ("Cannot Initialize new GD image stream");
$background_color = ImageColorAllocate ($im, 224, 234, 234);
$text_color = ImageColorAllocate ($im, 233, 14, 91);
// imageline ($im,$x1,$y1,$x2,$y2,$text_color);
imageline ($im,0,0,1,2,$text_color);
imageline ($im,1,0,0,2,$text_color);
ImagePng ($im);
?>

Next, I created the database table.


DROP TABLE IF EXISTS `blog_log`;
CREATE TABLE `blog_log` (
  `date` timestamp NOT NULL default '0000-00-00 00:00:00',
  `ip_num` double NOT NULL default '0',
  `uagent` varchar(200) default NULL,
  `visited_page` varchar(200) NOT NULL default '',
  UNIQUE KEY `date` (`date`,`ip_num`,`visited_page`)
) ENGINE=MyISAM DEFAULT CHARSET=latin1;

It’s done. I can now log any request I want using this embedded tracker.
Data should begin flowing to your database immediately. This sample snippet of code will allow you to pull data for a selected day and list each individual hit.


$query1 = "SELECT
                bl.ip_num,
                DATE_FORMAT(bl.date,'%d/%b/%Y %H:%i:%s') AS NEW_DATE,
                bl.uagent,
                bl.visited_page
        FROM blog_log bl
        WHERE
                DATE_FORMAT(bl.date,'%Y%m%d') ='$YMD'
		and uagent not REGEXP '(.*bot.*|.*crawl.*|.*spider.*|^-$|.*slurp.*|.*walker.*|.*lwp.*|.*teoma.*|.*aggregator.*|.*reader.*|.*libwww.*)'
        ORDER BY bl.date ASC";
print "<table border=\"1\">\n";
print "<tr><td>IP</td><td>DATE</td><td>USER-AGENT</td><td>PAGE VIEWED</td></tr>";
while ($row = mysql_fetch_array($result1)) {
        $visitor = long2ip($row[ip_num]);
        print "<tr><td>$visitor</td><td nowrap>$row[NEW_DATE]</td><td nowrap>$row[uagent]</td><td>";
	if ($row[visited_page] == ""){
    	    print " --- </td></tr>\n";
	} else {
    	    print "<a href=\"$row[visited_page]\" target=\_blank\">$row[visited_page]</a></td></tr>\n";
	}
}
mysql_close($link);

And that’s it. A few lines of code and you’re done. With a little tweaking, you can integrate the IP number data with a number of Geographic IP databases available for purchase to track by country and ISP, and using graphics applications for PHP, you can add graphs.
For my own purposes, this is an extension of the Geographic IP database I created a number of years ago. This application extracts IP address information from the five IP registrars, and inserts it into a database. Using the log data collected by the tracking bug above and the lookup capabilities of the Geographic IP database, I can quickly track which countries and ISP drive the most visitors to my site, and use this for general interest purposes, as well as the ability to isolate any malicious visitors to the site.

Browsers: The Window and The Firehose

Three years ago, in a post on this blog, I stated that I thought that the browser was becoming less important as more data moved into streams of data through RSS and aggregated feeds, as well as a raft of other consumer-oriented Web services.
This position was based on the assumption that the endpoint, in the form of installed applications, wouldcontinue to serve as the focus for user interactions, that these applications would be the points where data was accumulated and processed by users. This could be best described as the firehose: The end-user desktop would be at the end of a flood of data being pushed to it a never-ending flood.
Firefox and Chrome have changed all of that.
The browser has, instead, become the window through which we view and manipulate our data. It’s now ok, completely acceptable in fact, to use online applications as replacements for installed applications, stripping away a profit engine that has fed so many organizations over the years.
The endpoint has been shown to be the access point to our applications, to our data. Data is not brought and stored locally: It is stored remotely and manipulated like a marionette from afar.
While Chrome and Firefox are not perfect, they serve as powerful reminders of what the Web is, and why the browser exists. The Browser is not the end of a flod of incoming data, it is the window through which we see our online world.
While some complain that there is still an endless stream of data, we control and manipulate it. It doesn’t flood us.

Google Chrome: First Impressions

Google Chrome is out. And from first impressions, it is stinking fast. However, i do have some gripes.

  1. Comes with link underlining enabled. I hate this. It’s the first think I disable in Firefox and any browser that supports disabling underlining
  2. Where’s the “get your hands dirty under the hood” option list? I love the Firefox about:config list. Chrome needs this.
  3. Ads. I know. There is little chance for built in ad-blocking, but it’s on my wish-list.

Otherwise, it’s good…so far. And the memory usage is, well, definitely less intrusive.
I plan to use this for a while and see what happens. I will likely find something that drives me back to Firefox eventually.
Ok, found a weirdness when you use a <li> tag in the WordPress editor. It seems that it starts injecting <div> tags to differentiate paragraphs after you close out the list.

Google Chrome: One thing we do know… (HTTP Pipelining)


All: If you got here via a search, realize this is an old post (2008) and that Chrome now supports HTTP Pipelining and SPDY HTTP/3.  Thanks, smp.

As a Web performance consultant, I view the release of Google Chrome with slightly different eyes than many. And one of the items that I look for is how the browser will affect performance, especially perceived performance on the end-user desktop.

One thing I have been able to determine is that the use of WebKit will effectively rule out (to the best of my knowledge) the availability of HTTP Pipelining in the browser.

HTTP Pipelining is the ability, defined in RFC 2616, to request multiple HTTP objects simultaneously across an open TCP connection, and then handle their downloads using the features built into the HTTP/1.1 specifications.

I had an Apple employee in a class I taught a few months back confirm that Safari (which is built on WebKit) cannot use HTTP Pipeling for reason that are known only to the OS and TCP stack developers at Apple.

Now, if the team at Google has found a way to circumvent this problem, I will be impressed.

Web Performance: TechCrunch Goes Crunch

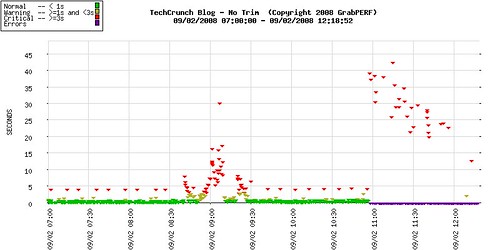
It’s the first day back after the last long weekend of the summer. There is a a great amount of news flooding the intertubes, and what happens?
TechCrunch has a small issue.

techcrunch-crunch-sep022008

It’s likely they’ll be back soon, but it’s still an interesting thing to see.

Update – 09:17 EDT (13:17 GMT)

TechCrunch is back up as of 08:49 EDT (12:49 GMT).

Web Performance, Part VIII: How do you define fast?

In the realm of Web performance measurement and monitoring, one of the eternal and ever-present questions remains “What is fast?”. The simple fact is that there is no single answer for this question, as it it isn’t a question with one quantitative answer that encompasses all the varied scenarios that are presented to the Web performance professional.

The answer that the people who ask the “What is fast?” question most often hear is “It depends”. And in most cases, it depends on the results of three distinct areas of analysis.

  1. Baselining
  2. Competitve Analysis
  3. Comparative Analysis

Baselining

Baselining is the process of examining Web performance results over a period of time to determine the inherent patterns that exist in the measurement data. It is critical that this process occur over a minimum period of 14 days, as there are a number of key patterns that will only appear within a period at least that long.

Baselining also provides some idea of what normal performance of a Web site or Web business process is. While this will provide some insight into the what can be expected from the site, in isolation it provides only a tiny glimpse into the complexity of how fast a Web site should be.

Baselining can identify the slow pages in a business process, or identify objects that may be causing noticeable performance degradation, its inherent isolation from the rest of the world it exists is its biggest failing. Companies that rely only on the performance data from their own sites to provide the context of what is fast are left with a very narrow view of the real world.

Competitive Analysis

All companies have competition. There is always a firm or organization whose sole purpose is to carve a niche out of your base of customers. It flows both ways, as your firm is trying to do exactly the same thing to other firms.

When you consider the performance of your online presence, which is likely accounting for a large (and growing) component of your revenue, why would you leave the effects of poor Web site performance your competitive analysis? And how do you know how your site is fairing against the other firms you are competing against on a daily basis?

Competitive analysis has been a key component of the Web performance measurement field since it appeared in the mid-1990s. Firms want to understand how they are doing against other firms in the same competitive space. They need to know if their Web site is at a quantitative advantage or disadvantage with these other firms.

Web sites are almost always different in their presentation and design, but they all serve the same purpose: To convert visitors to buyers. Measuring this process in a structured way allows companies to cut through the differences that exist in design and presentation and cut directly to heart of the matter: Show me the money.
Competitive measurements allow you to determine where your firm is strong, where it is weak, and how it should prioritize its efforts to make it a better site that more effectively serves the needs of the customers, and the needs of the business.

Comparative Analysis

Most astute readers will be wondering how comparative analysis differs from competitive analysis. The differences are, in fact, fundamental to the way they are used. Where competitive analysis provides insight into the unique business challenges faced by a group of firms serving the needs of similar customers, comparative analysis forces your organization to look at performance more broadly.

Your customers and visitors do not just visit your site. I know this may come as a surprise, but it’s true. As a result, they carry with them very clear ideas of how fast a fast site is. And while your organization may have overcome many challenges to become the performance leader in your sector, you can only say that you understand the true meaning of performance once you have stepped outside your comfort zone and compared yourself to the true leaders in performance online.

On a daily basis, your customers compare your search functionality to firms who do nothing but provide search results to millions of people each day. They compare how long it takes to autheticate and get a personalized landing page on your site to the experiences they have at their bank, their favourite retailers. The compare the speed with which specific product pages load.

They may not do this consciously. But these consumers carry with them an expectation of performance, and they know when your site is or is not delivering it.
So, how do you define fast? Fast is what you make it. As a firm with a Web site that is serving the needs of customers or visitors, you have to be ready to accept that there are others out there who have solved many of the problems you may be facing. Broaden your perspective and put your site in the harsh light of these three spotlights, and your organization will be on its way to evolving its Web performance perspective.

Copyright © 2025 Performance Zen

Theme by Anders NorenUp ↑